Alaska Trends
Top 49ers: Impact at Home and Beyond
Total Top 49ers Revenue more than $15.5 Billion
 Alaska Native Corps $12,245,273,807
 Construction & Engineering $352,588,287
 Finance $273,965,024
 Industrial Services $426,095,968
 Mining $79,000,000
 Retail/Wholesale $336,522,488
 Transportation $1,155,800,000
 Utility $635,538,932
Alaska Native Corps $12,245,273,807
Construction & Engineering $352,588,287
Finance $273,965,024
Industrial Services $426,095,968
Mining $79,000,000
Retail/Wholesale $336,522,488
Transportation $1,155,800,000
Utility $635,538,932
| Alaska Native Corporations |
2017 Revenue |
Change from 2016 |
2018 Alaskan Employees |
Change from 2017 |
2018 worldwide Employees |
Change from 2017 |
|---|---|---|---|---|---|---|
| Afognak Native Corporation |
$608,104,000 | 28.2% | 158 | 4.6% | 5,185 | 10.6% |
| Ahtna, Inc. | $238,000,000 | 9.3% | 309 | -17.4% | 1,380 | -2.3% |
| Aleut Corporation | $211,837,206 | 23.4% | 184 | -2.1% | 929 | -12.9% |
| Arctic Slope Regional Corporation |
$2,697,862,000 | 13.8% | 3,715 | 0.8% | 11,301 | -0.1% |
| Bering Straits Native Corporation |
$357,900,000 | 9.8% | 337 | -36.9% | 1,447 | -7.6% |
| Bethel Native Corporation |
$99,197,518 | 38.2% | 50 | -16.7% | 125 | 0.0% |
| Bristol Bay Native Corporation |
$1,659,345,000 | 8.8% | 1,550 | 20.0% | 3,860 | -11.9% |
| Calista Corporation | $480,200,000 | -2.4% | 800 | 1.5% | 3,000 | 3.4% |
| Cape Fox Corporation | $60,632,693 | -4.6% | 172 | 49.6% | 748 | 30.1% |
| Chenega Corporation | $876,000,000 | -5.5% | 219 | -23.7% | 5,600 | -6.5% |
| Chugach Alaska Corporation |
$920,000,000 | 9.3% | 1,000 | 25.0% | 6,400 | 6.7% |
| Cook Inlet Region, Inc. | $439,349,000 | 52.0% | 284 | 0.4% | 1,384 | -1.4% |
| Doyon, Limited | $290,548,000 | -4.9% | 591 | 10.1% | 888 | 6.9% |
| Goldbelt, Incorporated | $229,389,285 | -3.1% | 250 | 0.0% | 1,500 | 0.0% |
| Koniag, Inc. | $270,769,000 | 7.6% | 59 | 7.3% | 753 | 60.6% |
| NANA Regional Corporation |
$1,354,000,000 | 4.2% | 4,796 | -9.4% | 12,251 | -13.1% |
| Olgoonik Corporation | $260,200,000 | 7.6% | 114 | 12.9% | 834 | -16.7% |
| Sealaska | $293,400,000 | 101.6% | 50 | -2.0% | 300 | 13.6% |
| Sitnasuak Native Corporation |
$134,138,330 | 3.0% | 91 | -9.0% | 871 | -8.3% |
| Tanadgusix Corp. (TDX) | $111,700,000 | -8.6% | 281 | 99.3% | 639 | 11.7% |
| The Kuskokwim Corporation |
$104,276,146 | 17.5% | 13 | -13.3% | 180 | 33.3% |
| Tyonek Native Corporation |
$78,000,000 | -12.4% | 37 | – | 729 | 84.1% |
| Ukpeagvik Inupiat Corporation (UIC) |
$470,425,629 | 10.9% | 605 | 132.7% | 4,450 | 78.0% |
| Alaska Native Corporations total |
$12,245,273,807 | 13.2% | 15,665 | 10.1% | 64,754 | 11.2% |
| Construction & Engineering |
2017 Revenue |
Change from 2016 |
2018 Alaskan Employees |
Change from 2017 |
2018 worldwide Employees |
Change from 2017 |
|---|---|---|---|---|---|---|
| Cornerstone General Contractors, Inc. |
$40,439,104 | 39.2% | 25 | 0.0% | 25 | 0.0% |
| Davis Constructors & Engineers, Inc. |
$120,084,328 | 83.3% | 50 | -51.9% | 100 | -3.8% |
| Delta Constructors LLC | $81,550,000 | -32.7% | 225 | 350.0% | 600 | 71.4% |
| Roger Hickel Contracting, Inc. |
$69,514,855 | 30.1% | 58 | -10.8% | 78 | -2.5% |
| Watterson Construction Co. | $41,000,000 | -21.2% | 95 | 26.7% | 95 | 26.7% |
| Construction & Engineering Total |
$352,588,287 | 19.7% | 453 | 62.8% | 898 | 18.4% |
| Finance | 2017 Revenue |
Change from 2016 |
2018 Alaskan Employees |
Change from 2017 |
2018 worldwide Employees |
Change from 2017 |
|---|---|---|---|---|---|---|
| Credit Union 1 | $65,811,947 | 1.8% | 376 | 4.7% | 389 | 1.0% |
| Denali Federal Credit Union |
$55,828,077 | -3.7% | 304 | 2.7% | 311 | -9.1% |
| First National Bank Alaska | $152,325,000 | 1.2% | 651 | -2.1% | 651 | -2.1% |
| Finance total | $273,965,024 | -0.2% | 1,331 | 1.8% | 1,351 | -3.4% |
| Industrial Services | 2017 Revenue |
Change from 2016 |
2018 Alaskan Employees |
Change from 2017 |
2018 worldwide Employees |
Change from 2017 |
|---|---|---|---|---|---|---|
| Airport Equipment Rentals | $55,100,000 | 1.4% | 100 | 0.0% | 100 | 0.0% |
| Colville | $87,479,056 | -9.2% | 186 | -13.5% | 186 | -13.5% |
| Construction Machinery Industrial, LLC | $98,500,000 | 0.5% | 105 | 0.0% | 105 | 0.0% |
| Cruz Companies Alaska | $120,000,000 | -34.7% | 200 | 17.6% | 289 | 27.9 |
| Udelhoven Oilfield System Services |
$65,016,912 | -33.1% | 322 | 3.2% | 332 | -1.8% |
| Industrial Services total | $426,095,968 | -15% | 913 | 1.5% | 1,012 | 2.52% |
| Mining | 2017 Revenue |
Change from 2016 |
2018 Alaskan Employees |
Change from 2017 |
2018 worldwide Employees |
Change from 2017 |
|---|---|---|---|---|---|---|
| Usibelli Coal Mine | $79,000,000 | -1.3% | 141 | -4.7% | 176 | -3.8% |
| Mining total | $79,000,000 | -1.3% | 141 | -4.7% | 176 | -3.8% |
Alaska Native Corporation: Afognak Native Corporation
2017 Revenue: $608,104,000
Change from 2016: 28.2%
2018 Alaskan Employees: 158
Change from 2017: 4.6%
2018 worldwide Employees: 5,185
Change from 2017: 10.6%
Alaska Native Corporation: Ahtna, Inc.
2017 Revenue: $238,000,000
Change from 2016: 9.3%
2018 Alaskan Employees: 309
Change from 2017: -17.4%
2018 worldwide Employees: 1,380
Change from 2017: -2.3%
Alaska Native Corporation: Aleut Corporation
2017 Revenue: $211,837,206
Change from 2016: 23.4%
2018 Alaskan Employees: 184
Change from 2017: -2.1%
2018 worldwide Employees: 929
Change from 2017: -12.9%
Alaska Native Corporation: Arctic Slope Regional Corporation
2017 Revenue: $2,697,862,000
Change from 2016: 13.8%
2018 Alaskan Employees: 3,715
Change from 2017: 0.8%
2018 worldwide Employees: 11,301
Change from 2017: -0.1%
Alaska Native Corporation: Bering Straits Native Corporation
2017 Revenue: $357,900,000
Change from 2016: 9.8%
2018 Alaskan Employees: 337
Change from 2017: -36.9%
2018 worldwide Employees: 1,447
Change from 2017: -7.6%
Alaska Native Corporation: Bethel Native Corporation
2017 Revenue: $99,197,518
Change from 2016: 38.2%
2018 Alaskan Employees: 50
Change from 2017: -16.7%
2018 worldwide Employees: 125
Change from 2017: 0.0%
Alaska Native Corporation: Bristol Bay Native Corporation
2017 Revenue: $1,659,345,000
Change from 2016: 8.8%
2018 Alaskan Employees: 1,550
Change from 2017: 20.0%
2018 worldwide Employees: 3,860
Change from 2017: -11.9%
Alaska Native Corporation: Calista Corporation
2017 Revenue: $480,200,000
Change from 2016: -2.4%
2018 Alaskan Employees: 800
Change from 2017: 1.5%
2018 worldwide Employees: 3,000
Change from 2017: 3.4%
Alaska Native Corporation: Cape Fox Corporation
2017 Revenue: $60,632,693
Change from 2016: -4.6%
2018 Alaskan Employees: 172
Change from 2017: 49.6%
2018 worldwide Employees: 748
Change from 2017: 30.1%
Alaska Native Corporation: Chenega Corporation
2017 Revenue: $876,000,000
Change from 2016: -5.5%
2018 Alaskan Employees: 219
Change from 2017: -23.7%
2018 worldwide Employees: 5,600
Change from 2017: -6.5%
Alaska Native Corporation: Chugach Alaska Corporation
2017 Revenue: $920,000,000
Change from 2016: 9.3%
2018 Alaskan Employees: 1,000
Change from 2017: 25.0%
2018 worldwide Employees: 6,400
Change from 2017: 6.7%
Alaska Native Corporation: Cook Inlet Region, Inc.
2017 Revenue: $439,349,000
Change from 2016: 52.0%
2018 Alaskan Employees: 284
Change from 2017: 0.4%
2018 worldwide Employees: 1,384
Change from 2017: -1.4%
Alaska Native Corporation: Doyon, Limited
2017 Revenue: $290,548,000
Change from 2016: -4.9%
2018 Alaskan Employees: 591
Change from 2017: 10.1%
2018 worldwide Employees: 888
Change from 2017: 6.9%
Alaska Native Corporation: Goldbelt, Incorporated
2017 Revenue: $229,389,285
Change from 2016: -3.1%
2018 Alaskan Employees: 250
Change from 2017: 0.0%
2018 worldwide Employees: 1,500
Change from 2017: 0.0%
Alaska Native Corporation: Koniag, Inc.
2017 Revenue: $270,769,000
Change from 2016: 7.6%
2018 Alaskan Employees: 59
Change from 2017: 7.3%
2018 worldwide Employees: 753
Change from 2017: 60.6%
Alaska Native Corporation: NANA Regional Corporation
2017 Revenue: $1,354,000,000
Change from 2016: 4.2%
2018 Alaskan Employees: 4,796
Change from 2017: -9.4%
2018 worldwide Employees: 12,251
Change from 2017: -13.1%
Alaska Native Corporation: Olgoonik Corporation
2017 Revenue: $260,200,000
Change from 2016: 7.6%
2018 Alaskan Employees: 114
Change from 2017: 12.9%
2018 worldwide Employees: 834
Change from 2017: -16.7%
Alaska Native Corporation: Sealaska
2017 Revenue: $293,400,000
Change from 2016: 101.6%
2018 Alaskan Employees: 50
Change from 2017: -2.0%
2018 worldwide Employees: 300
Change from 2017: 13.6%
Alaska Native Corporation: Sitnasuak Native Corporation
2017 Revenue: $134,138,330
Change from 2016: 3.0%
2018 Alaskan Employees: 91
Change from 2017: -9.0%
2018 worldwide Employees: 871
Change from 2017: -8.3%
Alaska Native Corporation: Tanadgusix Corp. (TDX)
2017 Revenue: $111,700,000
Change from 2016: -8.6%
2018 Alaskan Employees: 281
Change from 2017: 99.3%
2018 worldwide Employees: 639
Change from 2017: 11.7%
Alaska Native Corporation: The Kuskokwim Corporation
2017 Revenue: $104,276,146
Change from 2016: 17.5%
2018 Alaskan Employees: 13
Change from 2017: -13.3%
2018 worldwide Employees: 180
Change from 2017: 33.3%
Alaska Native Corporation: Tyonek Native Corporation
2017 Revenue: $78,000,000
Change from 2016: -12.4%
2018 Alaskan Employees: 37
Change from 2017: –
2018 worldwide Employees: 729
Change from 2017: 84.1%
Alaska Native Corporation: Ukpeagvik Inupiat Corporation (UIC)
2017 Revenue: $470,425,629
Change from 2016: 10.9%
2018 Alaskan Employees: 605
Change from 2017: 132.7%
2018 worldwide Employees: 4,450
Change from 2017: 78.0%
Alaska Native Corporations total
2017 Revenue: $12,245,273,807
Change from 2016: 13.2%
2018 Alaskan Employees: 15,665
Change from 2017: 10.1%
2018 worldwide Employees: 64,754
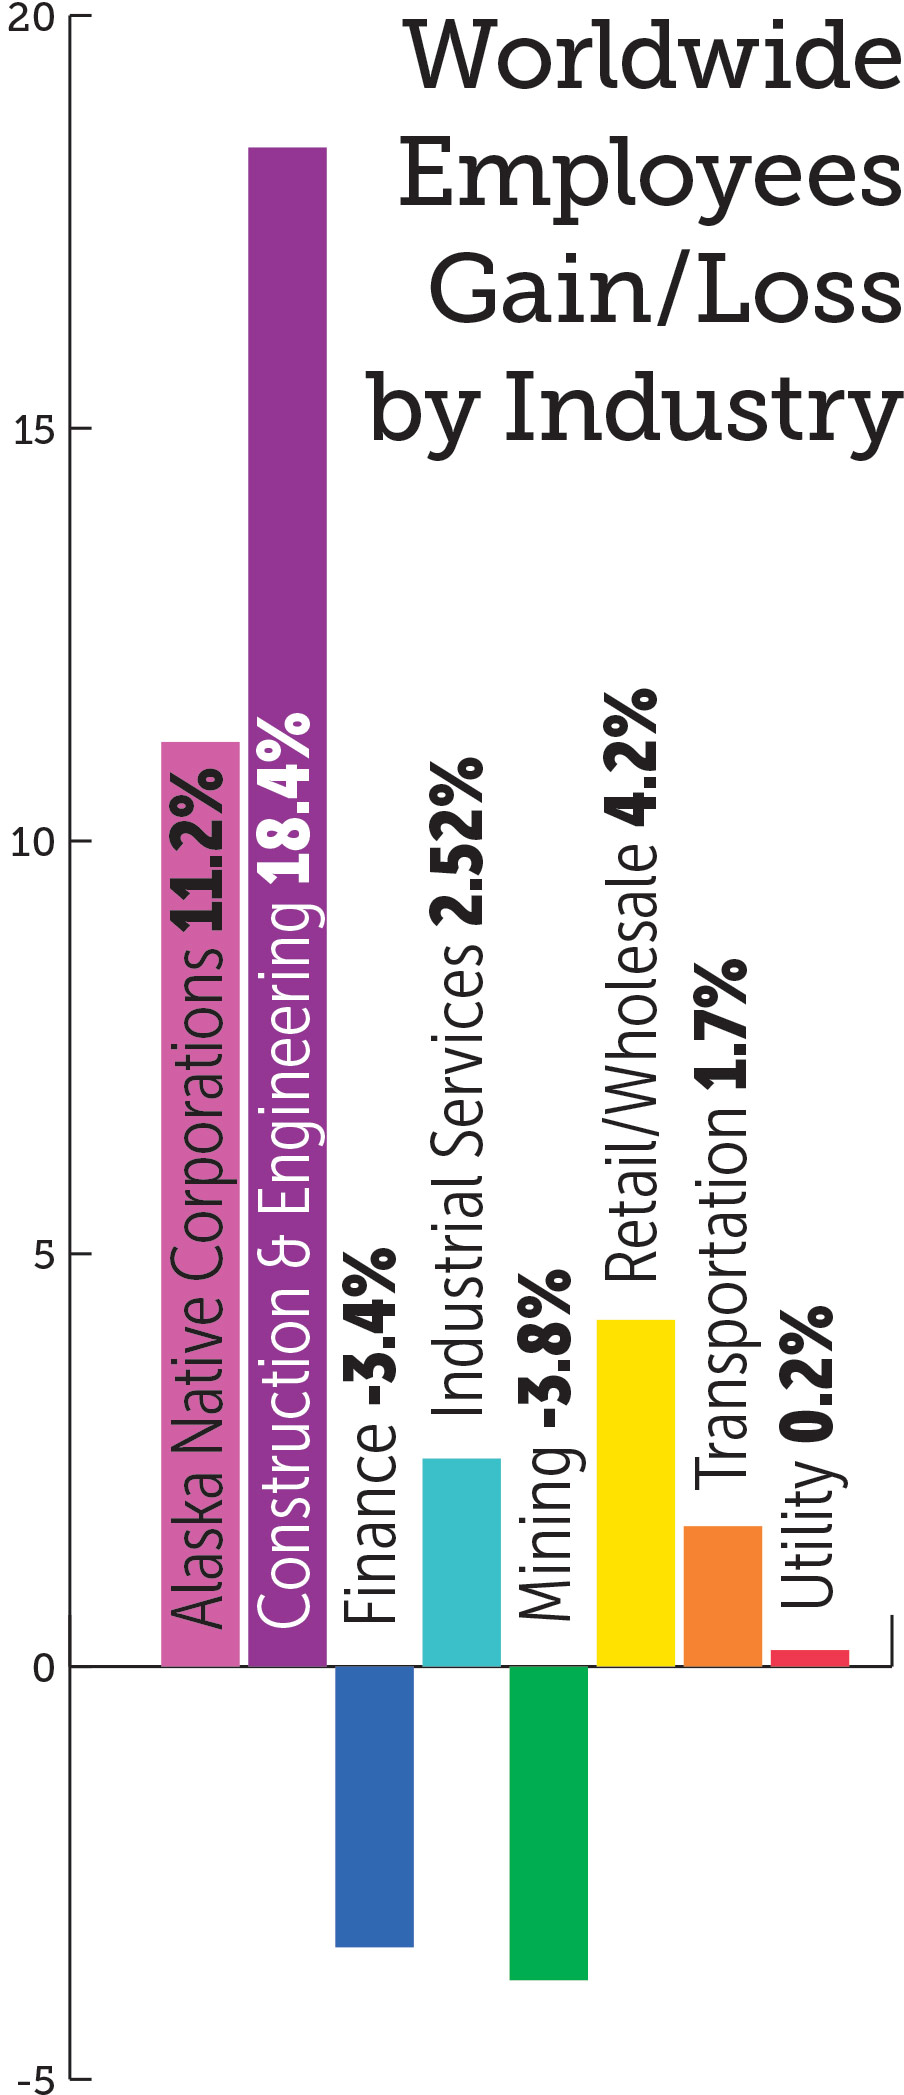
Change from 2017: 11.2%
Construction & Engineering: Cornerstone General Contractors, Inc.
2017 Revenue: $40,439,104
Change from 2016: 39.2%
2018 Alaskan Employees: 25
Change from 2017: 0.0%
2018 worldwide Employees: 25
Change from 2017: 0.0%
Construction & Engineering: Davis Constructors & Engineers, Inc.
2017 Revenue: $120,084,328
Change from 2016: 83.3%
2018 Alaskan Employees: 50
Change from 2017: -51.9%
2018 worldwide Employees: 100
Change from 2017: -3.8%
Construction & Engineering: Delta Constructors LLC
2017 Revenue: $81,550,000
Change from 2016: -32.7%
2018 Alaskan Employees: 225
Change from 2017: 350.0%
2018 worldwide Employees: 600
Change from 2017: 71.4%
Construction & Engineering: Roger Hickel Contracting, Inc.
2017 Revenue: $69,514,855
Change from 2016: 30.1%
2018 Alaskan Employees: 58
Change from 2017: -10.8%
2018 worldwide Employees: 78
Change from 2017: -2.5%
Construction & Engineering: Watterson Construction Co.
2017 Revenue: $41,000,000
Change from 2016: -21.2%
2018 Alaskan Employees: 95
Change from 2017: 26.7%
2018 worldwide Employees: 95
Change from 2017: 26.7%
Construction & Engineering total
2017 Revenue: $352,588,287
Change from 2016: 19.7%
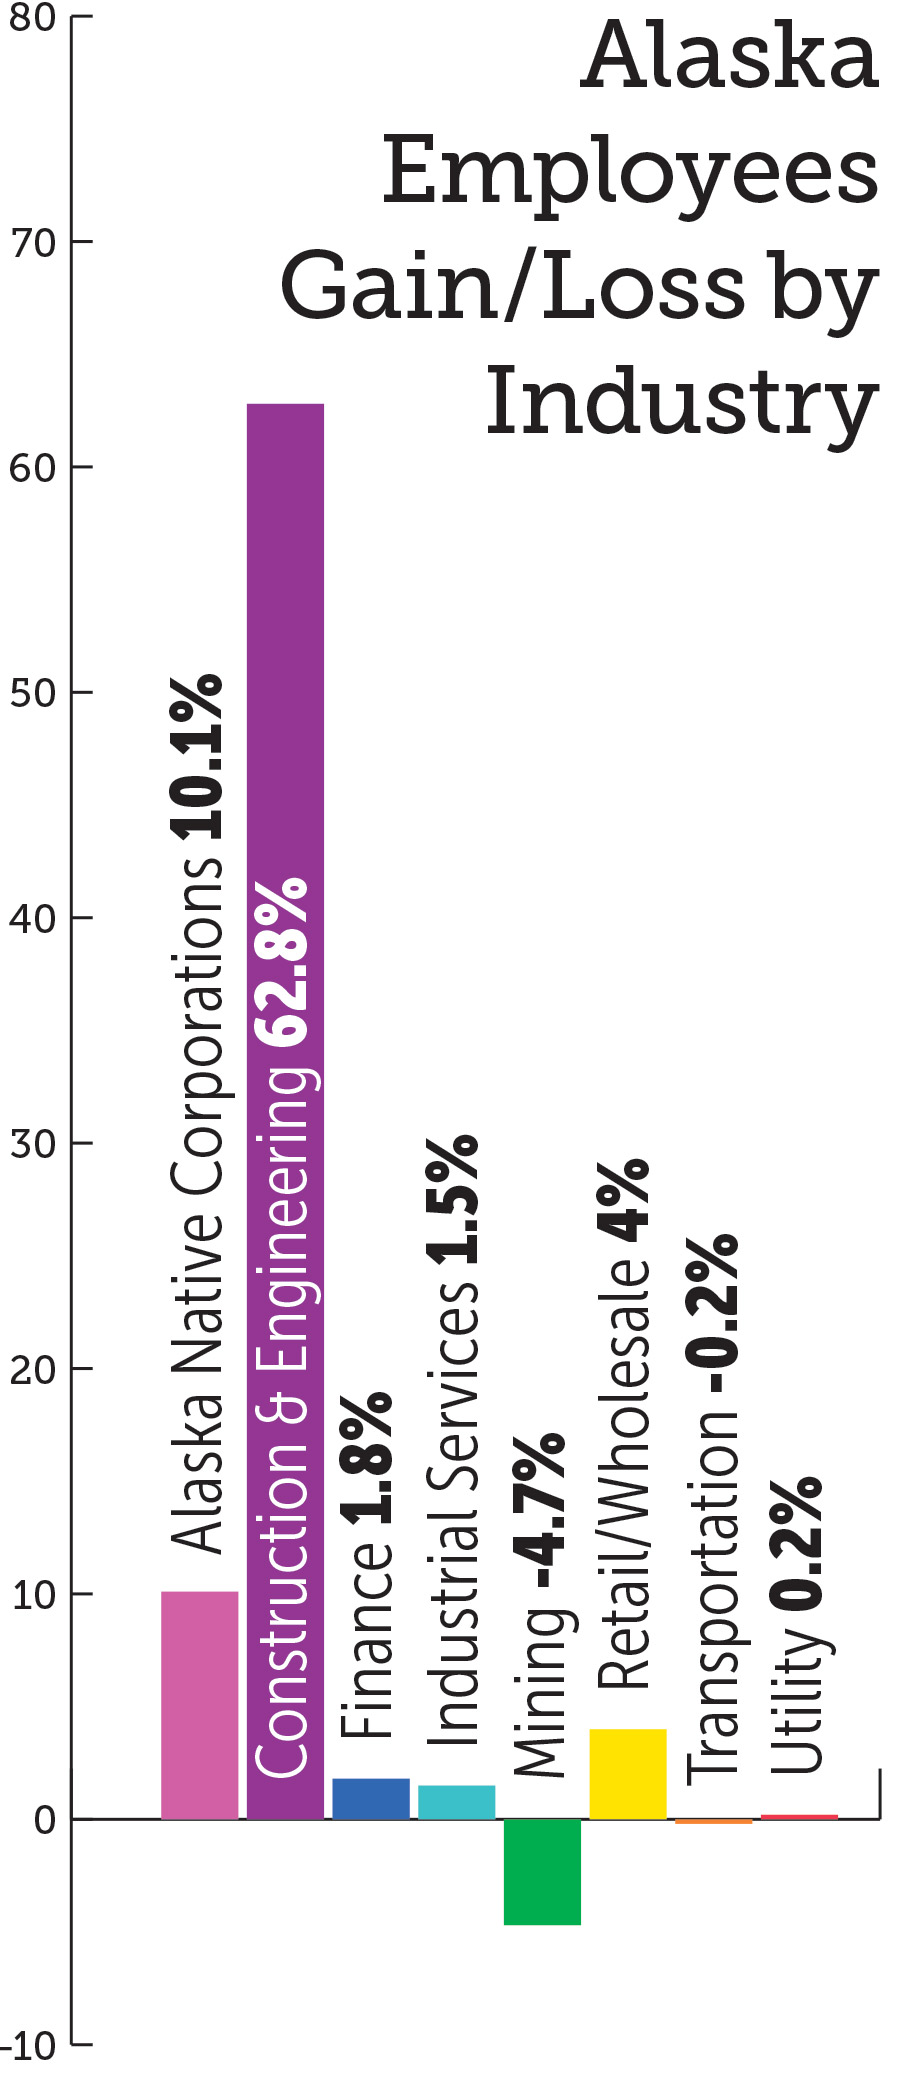
2018 Alaskan Employees: 453
Change from 2017: 62.8%
2018 worldwide Employees: 898
Change from 2017: 18.4%
Finance: Credit Union 1
2017 Revenue: $65,811,947
Change from 2016: 1.8%
2018 Alaskan Employees: 376
Change from 2017: 4.7%
2018 worldwide Employees: 389
Change from 2017: 1.0%
Finance: Denali Federal Credit Union
2017 Revenue: $55,828,077
Change from 2016: -3.7%
2018 Alaskan Employees: 304
Change from 2017: 2.7%
2018 worldwide Employees: 311
Change from 2017: -9.1%
Finance: First National Bank Alaska
2017 Revenue: $152,325,000
Change from 2016: 1.2%
2018 Alaskan Employees: 651
Change from 2017: -2.1%
2018 worldwide Employees: 651
Change from 2017: -2.1%
Finance total
2017 Revenue: $273,965,024
Change from 2016: -0.2%
2018 Alaskan Employees: 1,331
Change from 2017: 1.8%
2018 worldwide Employees: 1,351
Change from 2017: -3.4%
Industrial Service: Airport Equipment Rentals
2017 Revenue: $55,100,000
Change from 2016: 1.4%
2018 Alaskan Employees: 100
Change from 2017: 0.0%
2018 worldwide Employees: 100
Change from 2017: 0.0%
Industrial Service: Colville
2017 Revenue: $87,479,056
Change from 2016: -9.2%
2018 Alaskan Employees: 186
Change from 2017: -13.5%
2018 worldwide Employees: 186
Change from 2017: -13.5%
Industrial Service: Construction Machinery Industrial, LLC
2017 Revenue: $98,500,000
Change from 2016: 0.5%
2018 Alaskan Employees: 105
Change from 2017: 0.0%
2018 worldwide Employees: 105
Change from 2017: 0.0%
Industrial Service: Cruz Companies Alaska
2017 Revenue: $120,000,000
Change from 2016: -34.7%
2018 Alaskan Employees: 200
Change from 2017: 17.6%
2018 worldwide Employees: 289
Change from 2017: 27.9%
Industrial Service: Udelhoven Oilfield System Services
2017 Revenue: $65,016,912
Change from 2016: -33.1%
2018 Alaskan Employees: 322
Change from 2017: 3.2%
2018 worldwide Employees: 332
Change from 2017: -1.8%
Industrial Services total
2017 Revenue: $426,095,968
Change from 2016: -15%
2018 Alaskan Employees: 913
Change from 2017: 1.5%
2018 worldwide Employees: 1,012
Change from 2017: 2.52%
Mining: Usibelli Coal Mine
2017 Revenue: $79,000,000
Change from 2016: -1.3%
2018 Alaskan Employees: 141
Change from 2017: -4.7%
2018 worldwide Employees: 176
Change from 2017: -3.8%
Mining total
2017 Revenue: $79,000,000
Change from 2016: -1.3%
2018 Alaskan Employees: 141
Change from 2017: -4.7%
2018 worldwide Employees: 176
Change from 2017: -3.8%
Alaska Employees by Industry 2018
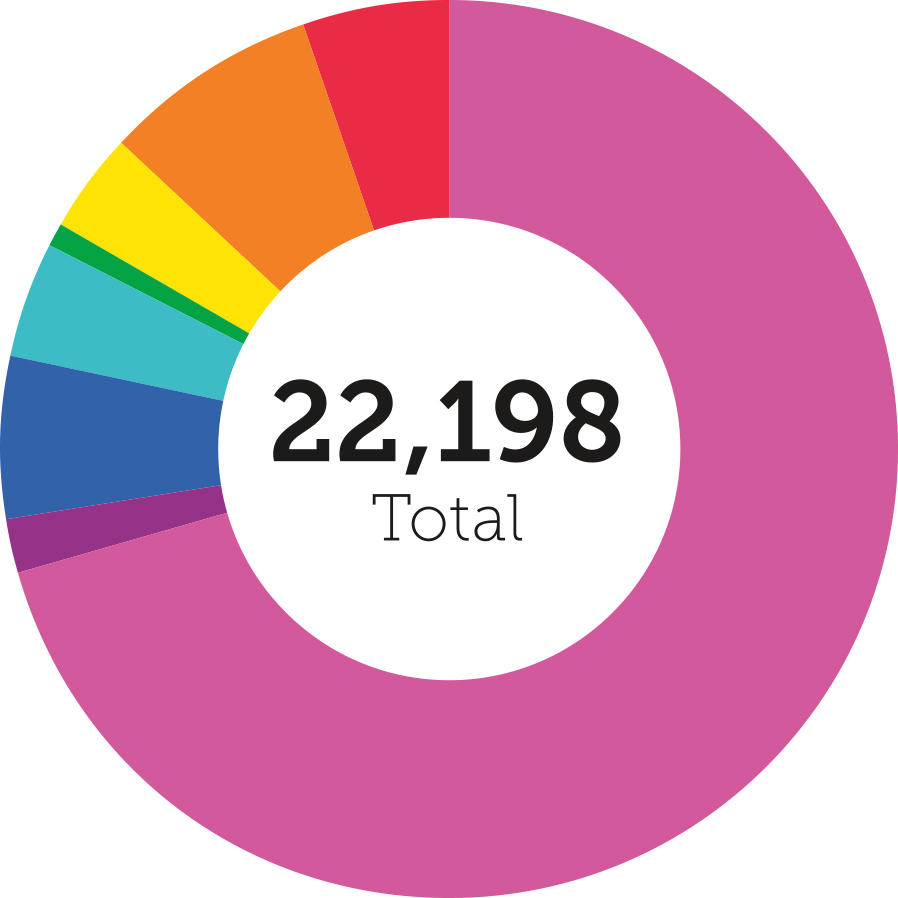
Alaska Native Corps 15,665
Construction & Engineering 453
Finance 1,331
Industrial Services 913
Mining 141
Retail/Wholesale 834
Transportation 1,701
Utility 1,160
Worldwide Employees by Industry 2018
Alaska Native Corps 64,754
Construction & Engineering 898
Finance 1,351
Industrial Services 1,012
Mining 176
Retail/Wholesale 890
Transportation 3,762
Utility 1,160

Alaska Native Corps 64,754
Construction & Engineering 898
Finance 1,351
Industrial Services 1,012
Mining 176
Retail/Wholesale 890
Transportation 3,762
Utility 1,160
| Retail/Wholesale | 2017 Revenue |
Change from 2016 |
2018 Alaskan Employees |
Change from 2017 |
2018 worldwide Employees |
Change from 2017 |
|---|---|---|---|---|---|---|
| Anchorage Chrysler Dodge Center |
$90,546,881 | 13.4% | 100 | -4.8% | 100 | -4.8% |
| Seekins Ford Lincoln | $58,946,067 | 12.2% | 100 | -2.9% | 100 | -2.9% |
| Three Bears Alaska, Inc. | $187,029,540 | 8.0% | 634 | 19.8% | 690 | 20.2% |
| Retail/Wholesale total | $336,522,488 | 11.2% | 834 | 4% | 890 | 4.2% |
| Transportation | 2017 Revenue |
Change from 2016 |
2018 Alaskan Employees |
Change from 2017 |
2018 worldwide Employees |
Change from 2017 |
|---|---|---|---|---|---|---|
| Lynden | $950,000,000 | 2.7% | 950 | 0.0% | 2,600 | -7.1% |
| PenAir | $87,500,000 | -2.7% | 351 | -12.3% | 739 | 5.6% |
| Tatonduk Outfitters Ltd. | $63,800,000 | 17.9% | 330 | 11.5% | 353 | 8.3% |
| Vitus Energy | $54,500,000 | -0.9% | 70 | 0.0% | 70 | 0.0% |
| Transportation total | $1,155,800,000 | 4.3% | 1,701 | -0.2% | 3,762 | 1.7% |
| Utility | 2017 Revenue |
Change from 2016 |
2018 Alaskan Employees |
Change from 2017 |
2018 worldwide Employees |
Change from 2017 |
|---|---|---|---|---|---|---|
| Alaska Village Electric Cooperative, Inc. |
$46,500,000 | -6.1% | 140 | -12.5% | 140 | -12.5% |
| Chugach Electric Association |
$224,689,000 | 13.6% | 302 | 0.7% | 302 | 0.7% |
| Homer Electric Association |
$99,000,000 | 4.2% | 138 | 0.7% | 138 | 0.7% |
| Matanuska Electric Association |
$148,701,932 | 8.3% | 195 | 2.6% | 195 | 2.6% |
| MTA | $116,648,000 | 16.6% | 385 | 9.4% | 385 | 9.4% |
| Utility total | $635,538,932 | 7.3% | 1,160 | 0.2% | 1,160 | 0.2% |
Retail/Wholesale: Anchorage Chrysler Dodge Center
2017 Revenue: $90,546,881
Change from 2016: 13.4%
2018 Alaskan Employees: 100
Change from 2017: -4.8%
2018 worldwide Employees: 100
Change from 2017: -4.8%
Retail/Wholesale: Seekins Ford Lincoln
2017 Revenue: $58,946,067
Change from 2016: 12.2%
2018 Alaskan Employees: 100
Change from 2017: -2.9%
2018 worldwide Employees: 100
Change from 2017: -2.9%
Retail/Wholesale: Three Bears Alaska, Inc.
2017 Revenue: $187,029,540
Change from 2016: 8.0%
2018 Alaskan Employees: 634
Change from 2017: 19.8%
2018 worldwide Employees: 690
Change from 2017: 20.2%
Retail/Wholesale total
2017 Revenue: $336,522,488
Change from 2016: 11.2%
2018 Alaskan Employees: 834
Change from 2017: 4%
2018 worldwide Employees: 890
Change from 2017: 4.2%
Transportation: Lynden
2017 Revenue: $950,000,000
Change from 2016: 2.7%
2018 Alaskan Employees: 950
Change from 2017: 0.0%
2018 worldwide Employees: 2,600
Change from 2017: -7.1%
Transportation: PenAir
2017 Revenue: $87,500,000
Change from 2016: -2.7%
2018 Alaskan Employees: 351
Change from 2017: -12.3%
2018 worldwide Employees: 739
Change from 2017: 5.6%
Transportation: Tatonduk Outfitters Ltd.
2017 Revenue: $63,800,000
Change from 2016: 17.9%
2018 Alaskan Employees: 330
Change from 2017: 11.5%
2018 worldwide Employees: 353
Change from 2017: 8.3%
Transportation: Vitus Energy
2017 Revenue: $54,500,000
Change from 2016: -0.9%
2018 Alaskan Employees: 70
Change from 2017: 0.0%
2018 worldwide Employees: 70
Change from 2017: 0.0%
Transportation total
2017 Revenue: $1,155,800,000
Change from 2016: 4.3%
2018 Alaskan Employees: 1,701
Change from 2017: -0.2%
2018 worldwide Employees: 3,762
Change from 2017: 1.7%
Utility: Alaska Village Electric Cooperative, Inc.
2017 Revenue: $46,500,000
Change from 2016: -6.1%
2018 Alaskan Employees: 140
Change from 2017: -12.5%
2018 worldwide Employees: 140
Change from 2017: -12.5%
Utility: Chugach Electric Association
2017 Revenue: $224,689,000
Change from 2016: 13.6%
2018 Alaskan Employees: 302
Change from 2017: 0.7%
2018 worldwide Employees: 302
Change from 2017: 0.7%
Utility: Homer Electric Association
2017 Revenue: $99,000,000
Change from 2016: 4.2%
2018 Alaskan Employees: 138
Change from 2017: 0.7%
2018 worldwide Employees: 138
Change from 2017: 0.7%
Utility: Matanuska Electric Association
2017 Revenue: $148,701,932
Change from 2016: 8.3%
2018 Alaskan Employees: 195
Change from 2017: 2.6%
2018 worldwide Employees: 195
Change from 2017: 2.6%
Utility: MTA
2017 Revenue: $116,648,000
Change from 2016: 16.6%
2018 Alaskan Employees: 385
Change from 2017: 9.4%
2018 worldwide Employees: 385
Change from 2017: 9.4%
Utility total
2017 Revenue: $635,538,932
Change from 2016: 7.3%
2018 Alaskan Employees: 1,160
Change from 2017: 0.2%
2018 worldwide Employees: 1,160
Change from 2017: 0.2%
ANS Crude Oil Production

SOURCE: Alaska Department of Revenue Tax Division
ANS West Coast Crude Oil Prices

SOURCE: Alaska Department of Revenue Tax Division

Statewide Employment Figures
10/1976—7/2018
Seasonally Adjusted

SOURCE: Alaska Department of Labor and Workforce Development, Research & Analysis Section; and US BLS