Alaska Trends -Mine,Mine,Mine

AVERAGE
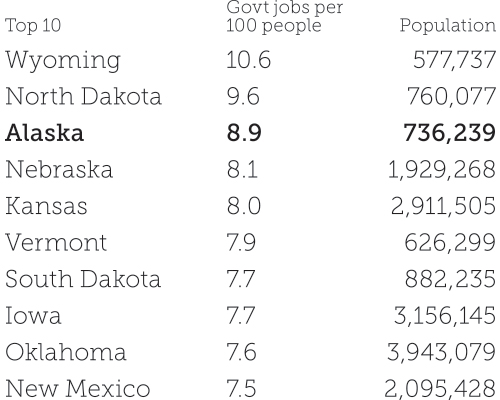
Wyoming
North Dakota
Alaska
Nebraska
Kansas
Vermont
South Dakota
Iowa
Oklahoma
New Mexico
10.6
9.6
8.9
8.1
8.0
7.9
7.7
7.7
7.6
7.5
577,737
760,077
736,239
1,929,268
2,911,505
626,299
882,235
3,156,145
3,943,079
2,095,428
Indiana
Tennessee
Georgia
Michigan
Arizona
Pennsylvania
Rhode Island
Nevada
Florida
5.9
5.7
5.6
5.5
5.0
4.7
4.7
4.7
4.6
6,691,878
6,770,010
10,519,475
9,995,915
7,171,646
12,807,060
1,057,315
3,034,392
21,299,325
Wyoming
North Dakota
Alaska
Nebraska
Kansas
Vermont
South Dakota
Iowa
Oklahoma
New Mexico
Indiana
Tennessee
Georgia
Michigan
Arizona
Pennsylvania
Rhode Island
Nevada
Florida
10.6
9.6
8.9
8.1
8.0
7.9
7.7
7.7
7.6
7.5
5.9
5.7
5.6
5.5
5.0
4.7
4.7
4.7
4.6
577,737
760,077
736,239
1,929,268
2,911,505
626,299
882,235
3,156,145
3,943,079
2,095,428
6,691,878
6,770,010
10,519,475
9,995,915
7,171,646
12,807,060
1,057,315
3,034,392
21,299,325
National Average Wage for a Government Employee $60,751
Alaska Average Wage for a Government Employee $59,469

Government jobs pay less than average in natural resource heavy areas, including Texas, Wyoming, and North Dakota.

Boroughs and unincorporated areas, called “census areas,” provide fewer services than counties, townships, and parishes in other parts of the country making Alaska’s state government responsible for more basic services.

States with high non-education government jobs all depend heavily on natural resources–oil in particular.
(Wyoming, North Dakota, and Alaska)
SOURCE: October 2019 Alaska Economic Trends, published by the Alaska Department of Labor and Workforce Development
ANS Crude Oil Production
ANS West Coast Crude Oil Prices

SOURCE: Alaska Department of Revenue Tax Division

SOURCE: Alaska Department of Revenue Tax Division
Seasonally Adjusted

SOURCE: Alaska Department of Labor and Workforce Development, Research & Analysis Section
ANS Crude Oil Production
SOURCE: Alaska Department of Revenue Tax Division
ANS West Coast Crude Oil Prices
SOURCE: Alaska Department of Revenue Tax Division
Statewide Employment Figures
Seasonally Adjusted
SOURCE: Alaska Department of Labor and Workforce Development, Research & Analysis Section