Alaska Trends
uonset huts rust at the defunct Naval Arctic Research Laboratory, yet the comfortable confines of Iḷisaġvik College (IC) nearby keep 462 credit-seeking and 717 non-credit-seeking students warm and educated. The school was established in 1996 upon the bones of the North Slope Higher Education Center developed by UAF and the North Slope Borough (NSB) in Barrow, now known as Utqiaġvik. Alaska’s only tribal college offers one bachelor’s degree in business administration and several associate degrees: Iñupiaq studies, Indigenous education, accounting, office management, construction technology, information technology, and allied health, plus endorsement programs in medical coding, heavy equipment operations, and industrial safety.
When North Slope employers promise to hire locally, IC trains that workforce. Does it succeed? To find out, IC commissioned a study by Lightcast, a firm that crunches economic and labor data for educational institutions and regional developers. Based on figures from fiscal year 2022–2023, “The results of this study show that IC creates a positive net impact on the borough economy and generates a return on investment for students, taxpayers, and society,” the authors state.
For instance, operations and student spending, combined with enhanced productivity of alumni, approximately equals the impact of the real estate sector, or about 0.7 percent of the North Slope Borough economy. The 2022-2023 graduates, the study found, are projected to receive a present net value of $17.7 million in increased earnings over their working lives, or a 25.5 percent rate of return.
This edition of Alaska Trends unravels that net of impacts, illustrating the college’s role in supporting Alaska industry and the North Slope community.
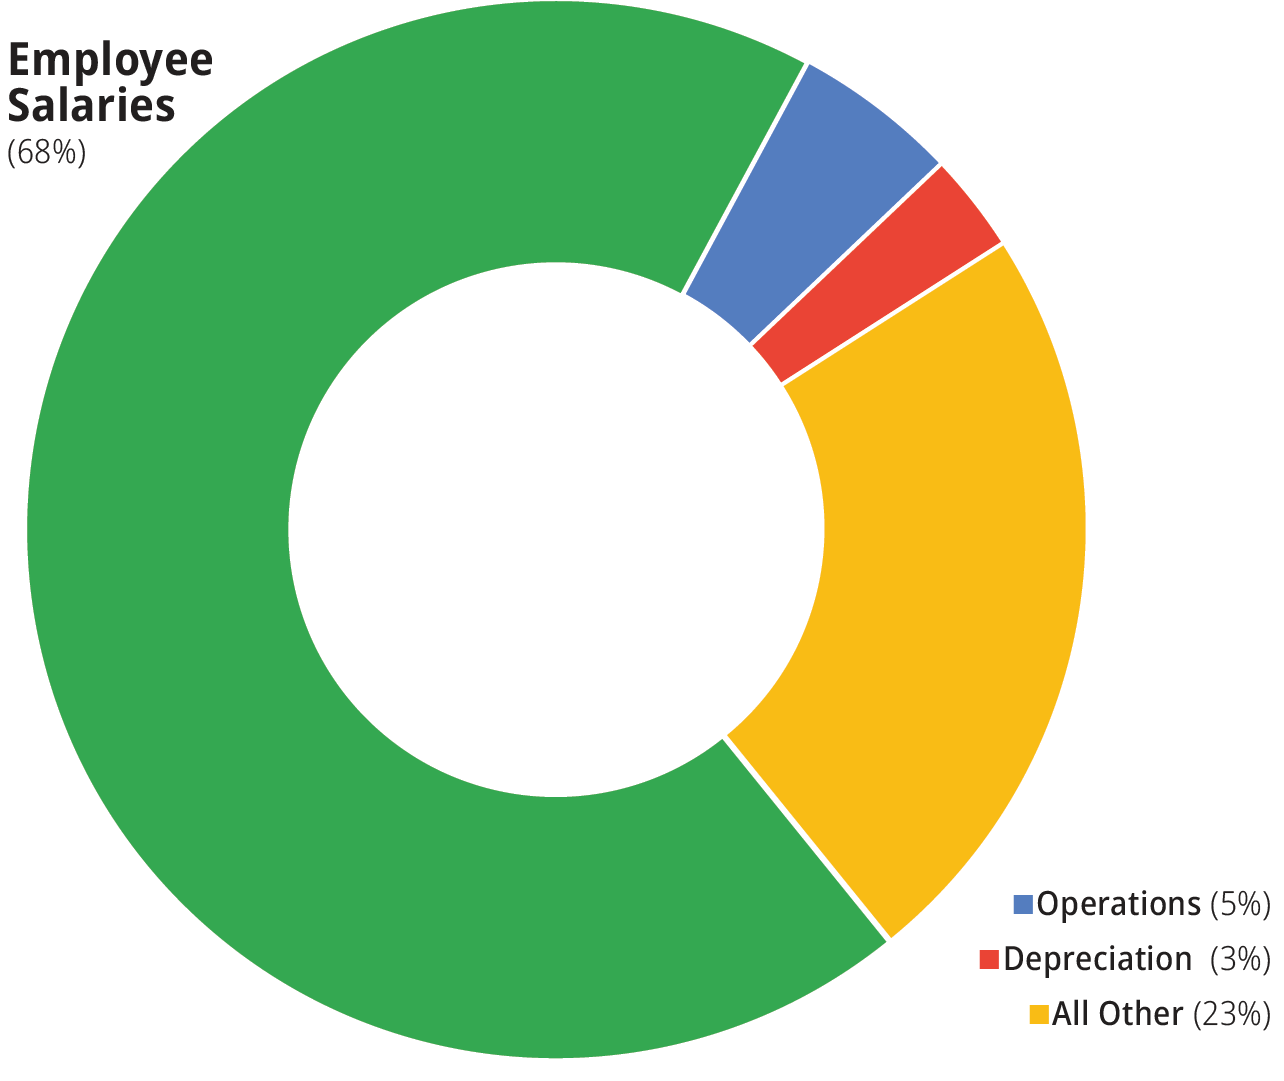
spent on payroll and benefits
spent on goods and services
added income generated

66% are local students.


added income from alumni
labor income from operations
total spending by students

of the students stay in Alaska after graduating from IC.
total faculty and staff
employees lived in the NSB
total students