

Alaska Trends
emphis is still the #1 destination for Graceland visitors. The Bluff City can cling to that superlative despite no longer having the nation’s busiest cargo airport. Restructuring by FedEx decreased domestic cargo through its Memphis hub by 20 percent, dropping the airport behind UPS hub Louisville, which handles more international shipping, and even below Miami, where 80 percent of cargo is from overseas, not subject to domestic fluctuations.
Which US airport, then, topped April’s ranking by Airports Council International World? Good ol’ Ted Stevens Anchorage International Airport. The Air Crossroads of the World has grown its cargo handling by 40 percent since 2019, when it ranked third in the US and sixth in the world. In 2025, only two other airports moved more cargo: Shanghai Pudong International at 4.1 million tonnes and the champion, Hong Kong International, at 5.1 million tonnes.
This month’s article “Anchorage Airport Takes Off” by Terri Marshall reports on updates at ANC driven by, and in support of, growth in cargo and passenger volume.
For this edition of Alaska Trends, we explore findings from the Alaska International Airport System (comprising the Ted Stevens Anchorage International Airport and Fairbanks International Airport) year-end report, detailing contributions from facilities credited with 26,000 jobs statewide and $2.3 billion in economic activity.
traveled through ANC & FAI in 2025.

2025 saw an 8% year-over-year increase which included a 7% increase in Lower 48 capacity.
for Concession sales per passenger in 2024.
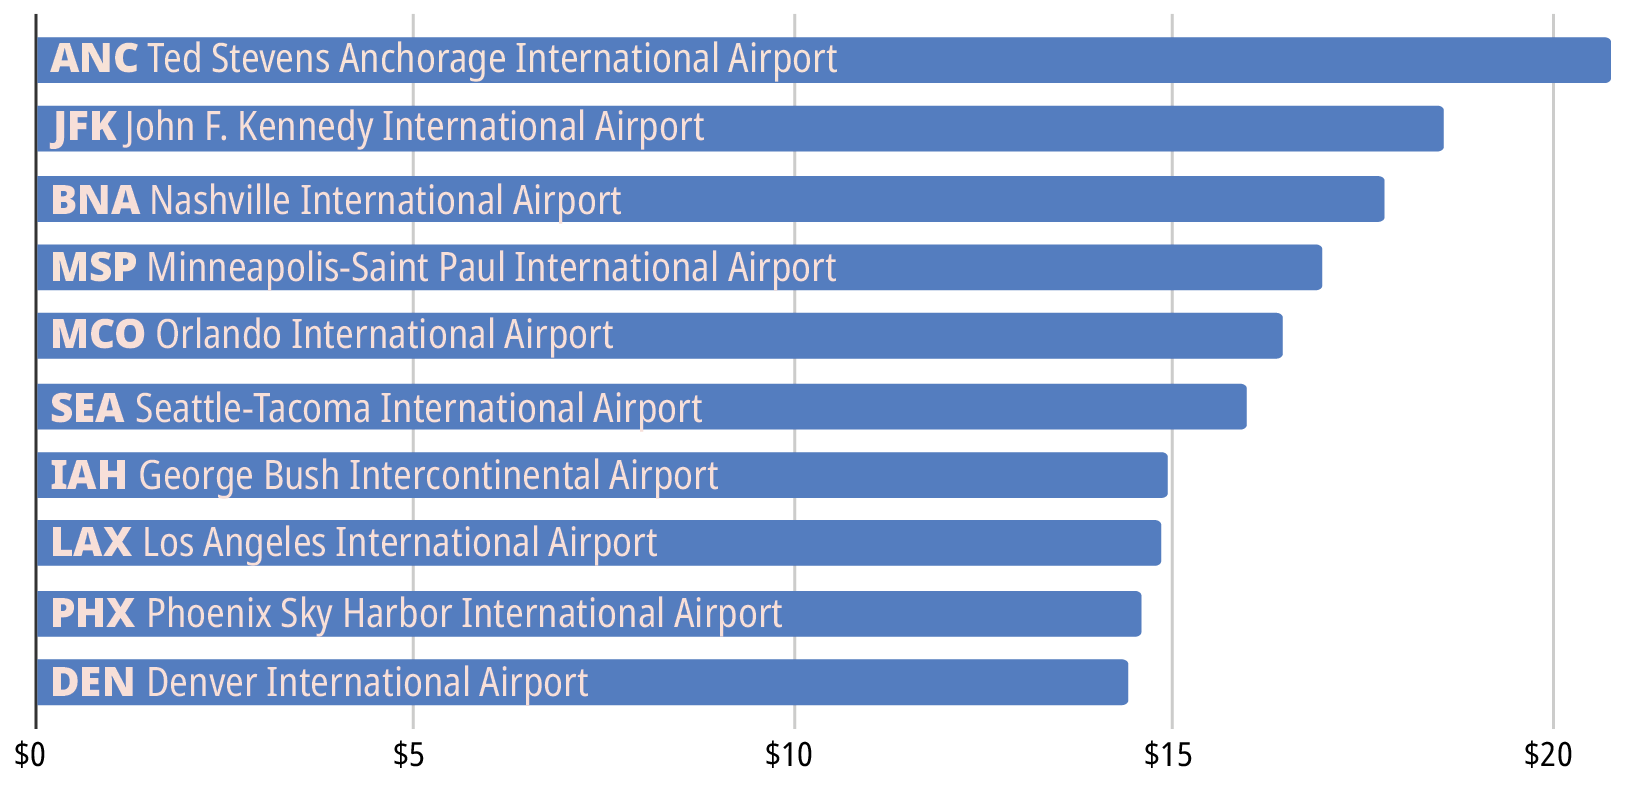
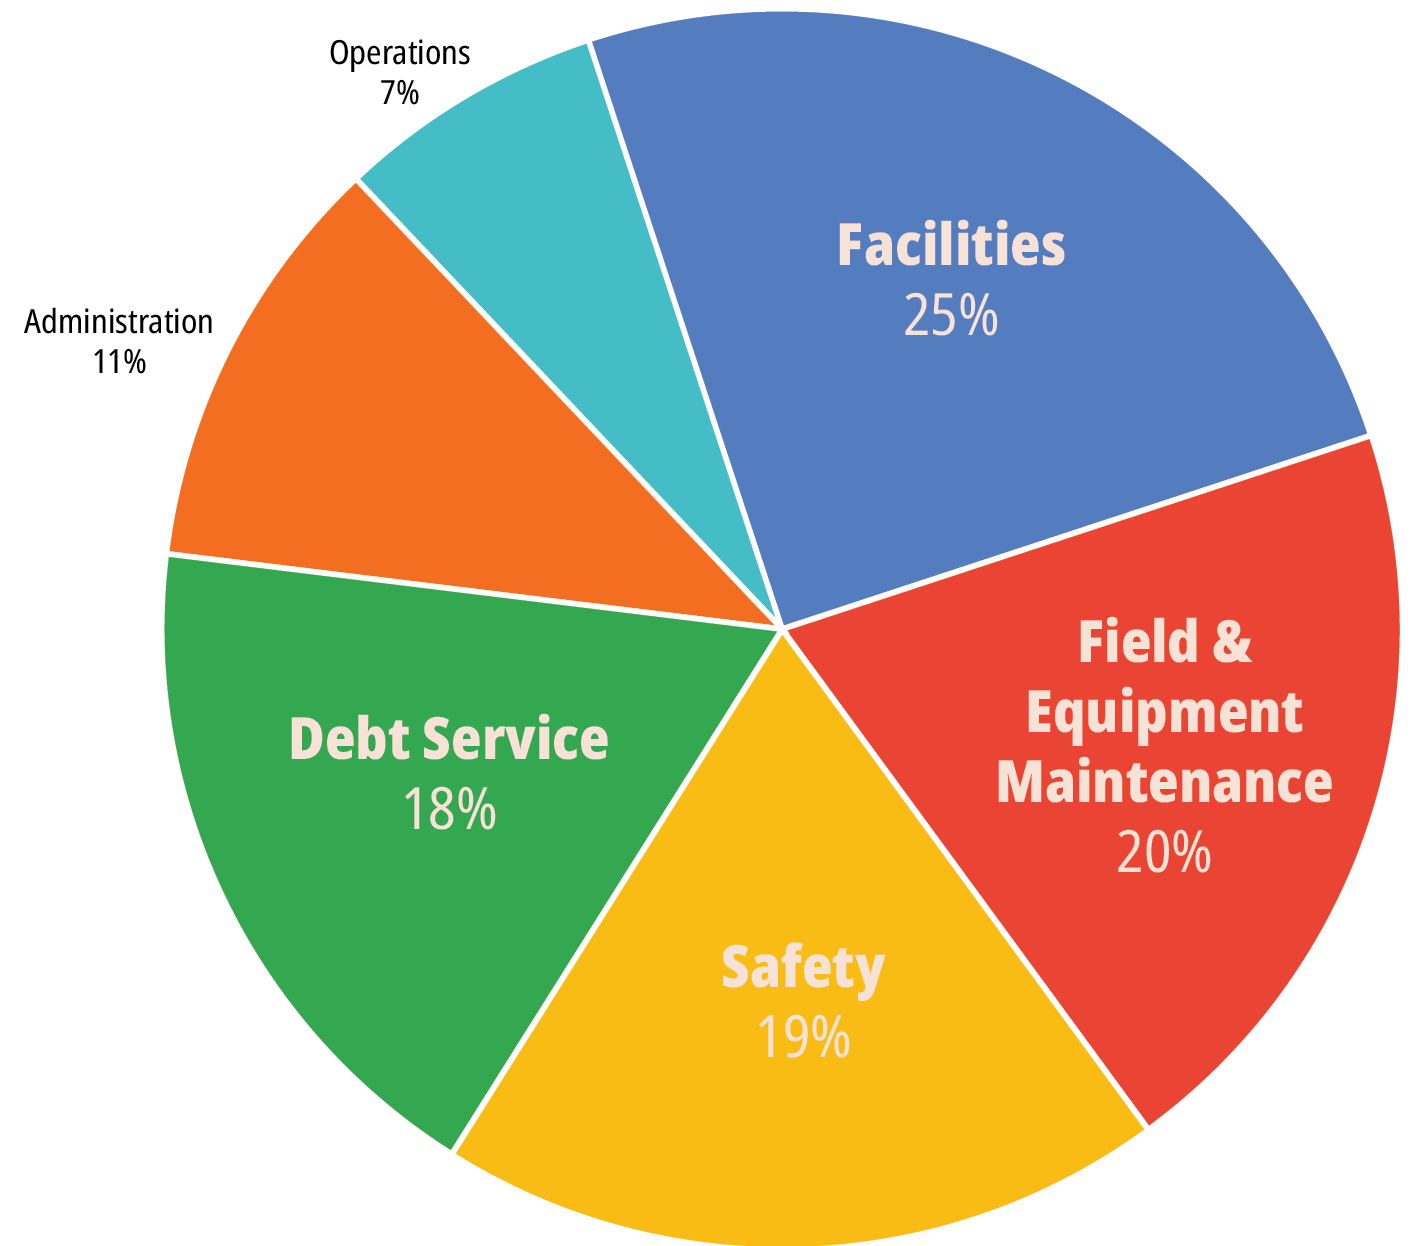
Total Operating Expenses
of cargo were handled by ANC

Revenue Increase


Increase