Alaska Trends
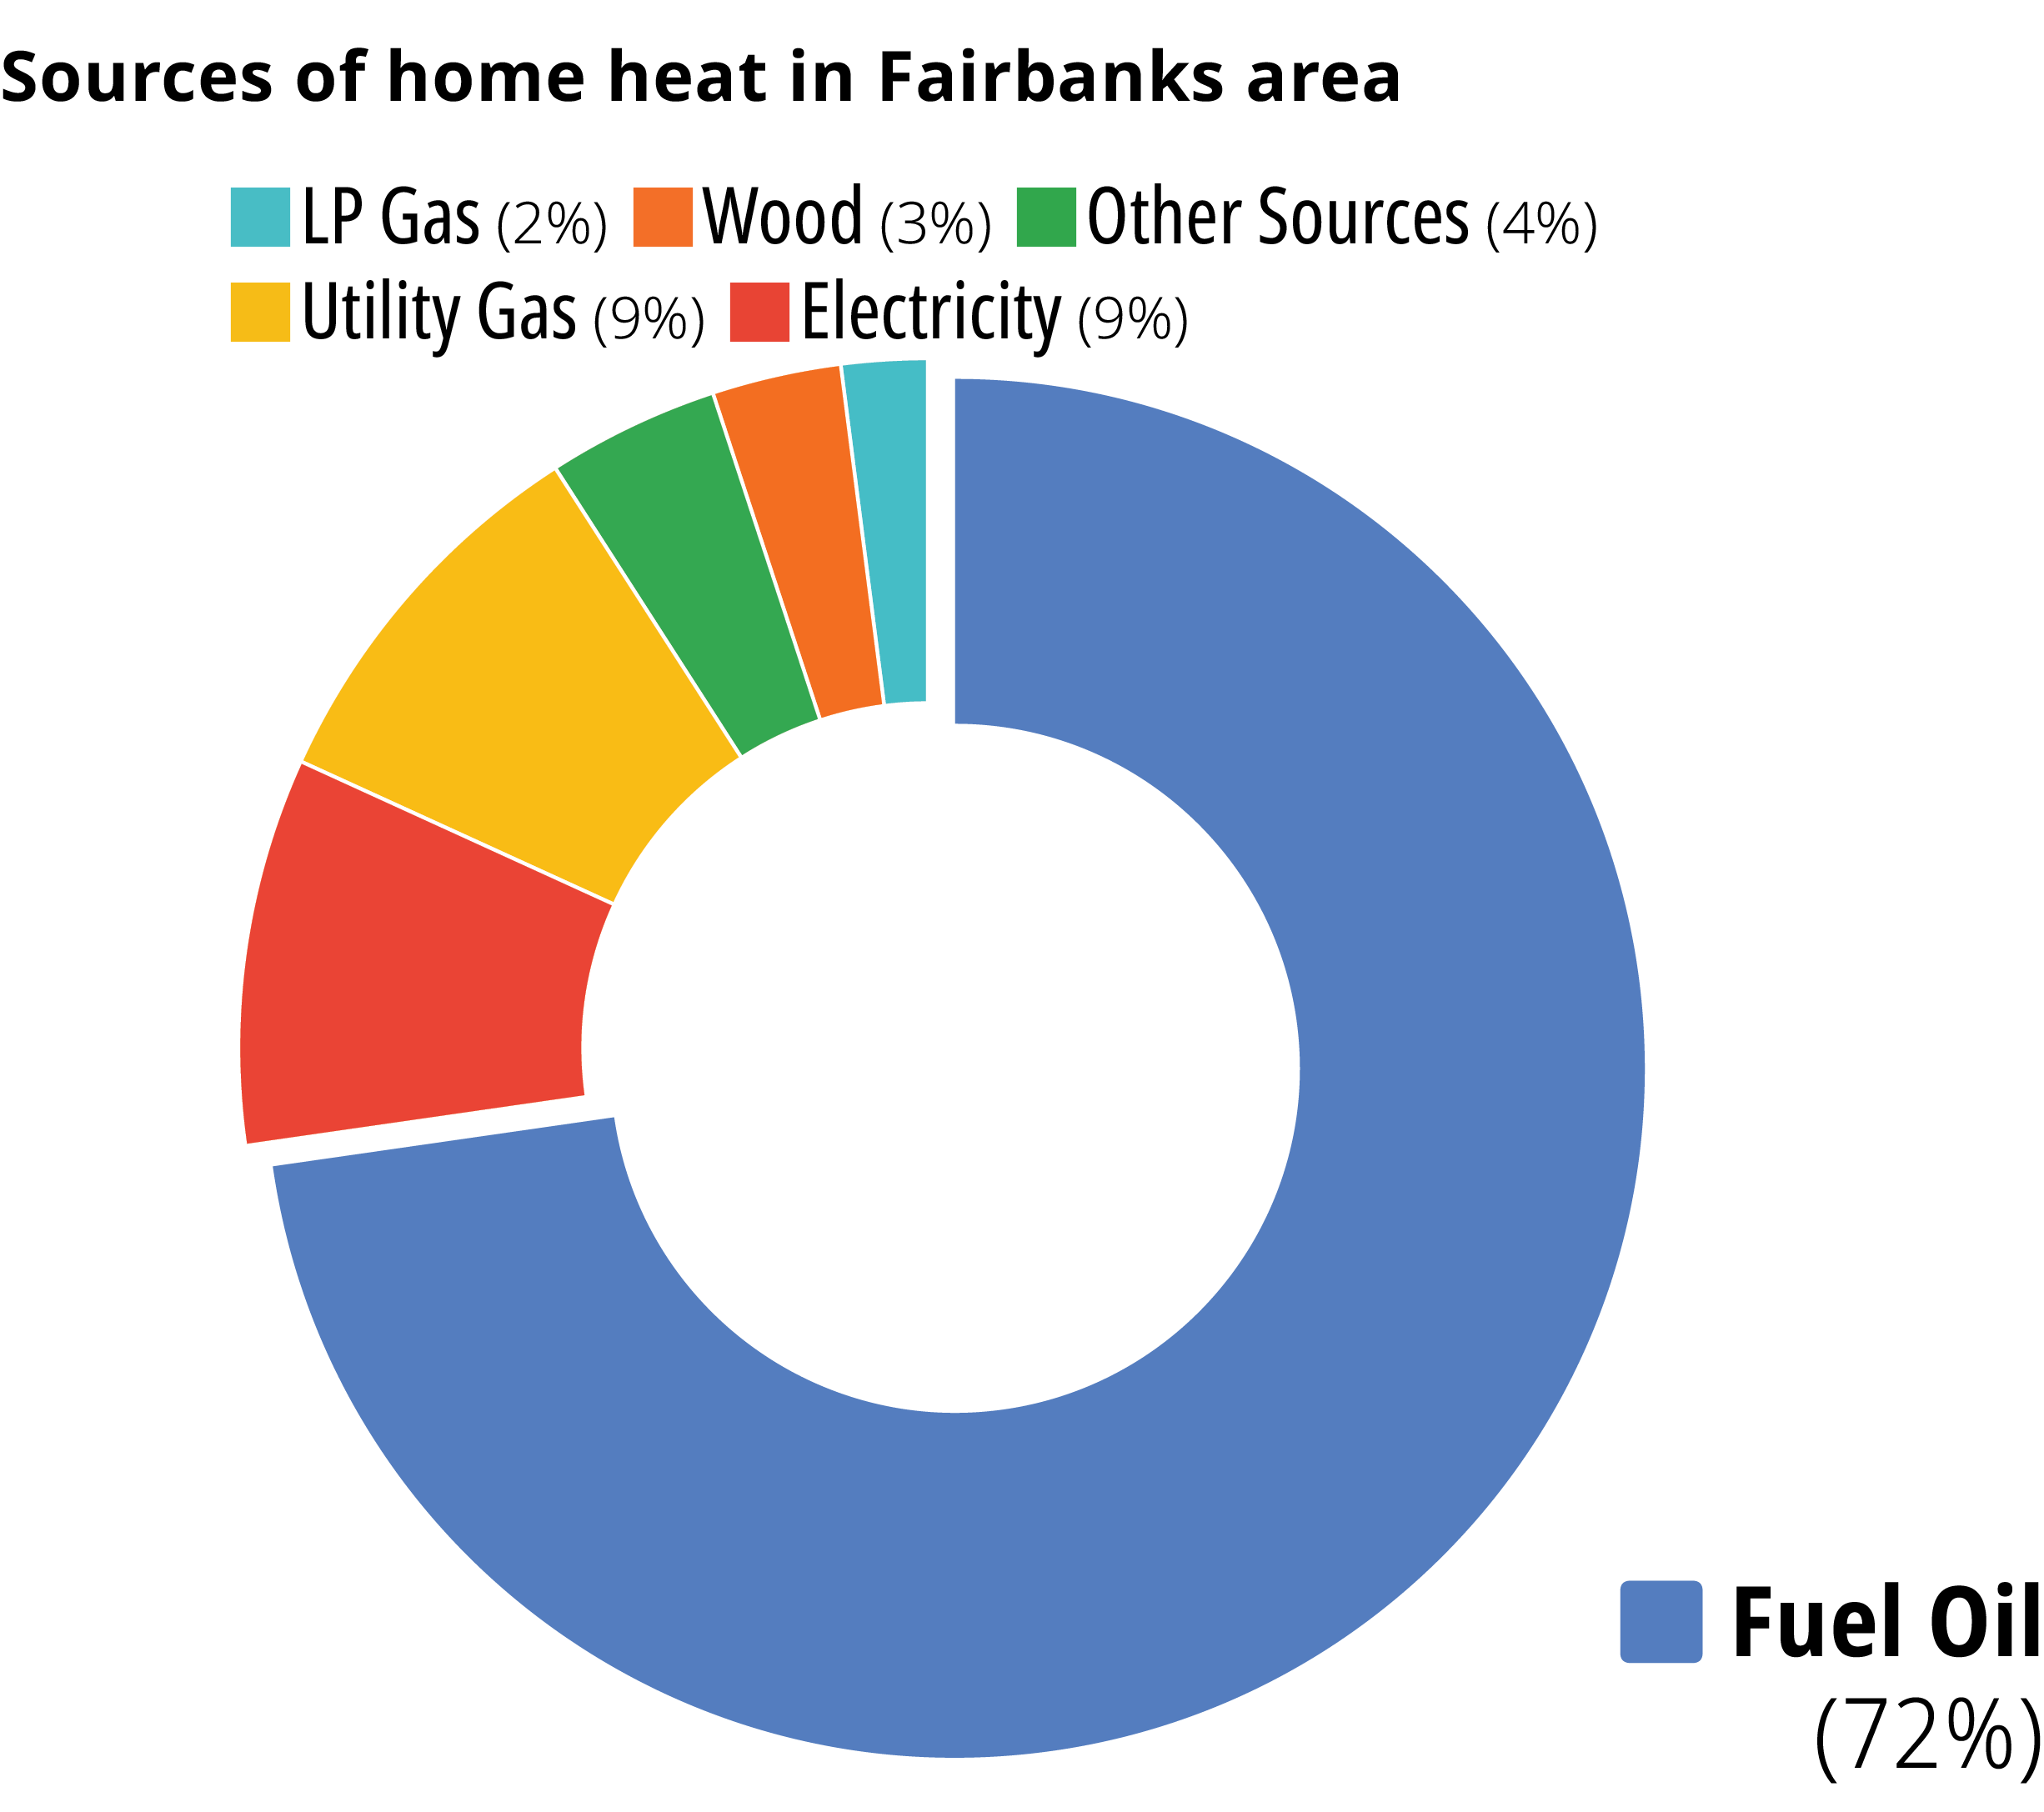
old, cold ground in the valleys along the Nenana River at Healy contains the hot, hot heat that powers 45 percent of electricity in the Interior. Usibelli Coal Mine has been digging in the dirt since 1943 for the energy resource that warms the region. The state’s only operating coal mine produces approximately 1 million tons of fossil fuel annually. About 35 percent is burned at two nearby power plants while the remainder is transported by the Alaska Railroad to Fairbanks-area power plants operated by Golden Valley Electric Association and Aurora Energy.
Usibelli Coal Mine commissioned McKinley Research Group to analyze the economic impact of coal in the Interior. The report—based on public information, data from Usibelli Coal Mine, and direct interviews—finds that mining in Healy supported $54.6 million in wages statewide, with 568 people employed at the mine itself in 2023.
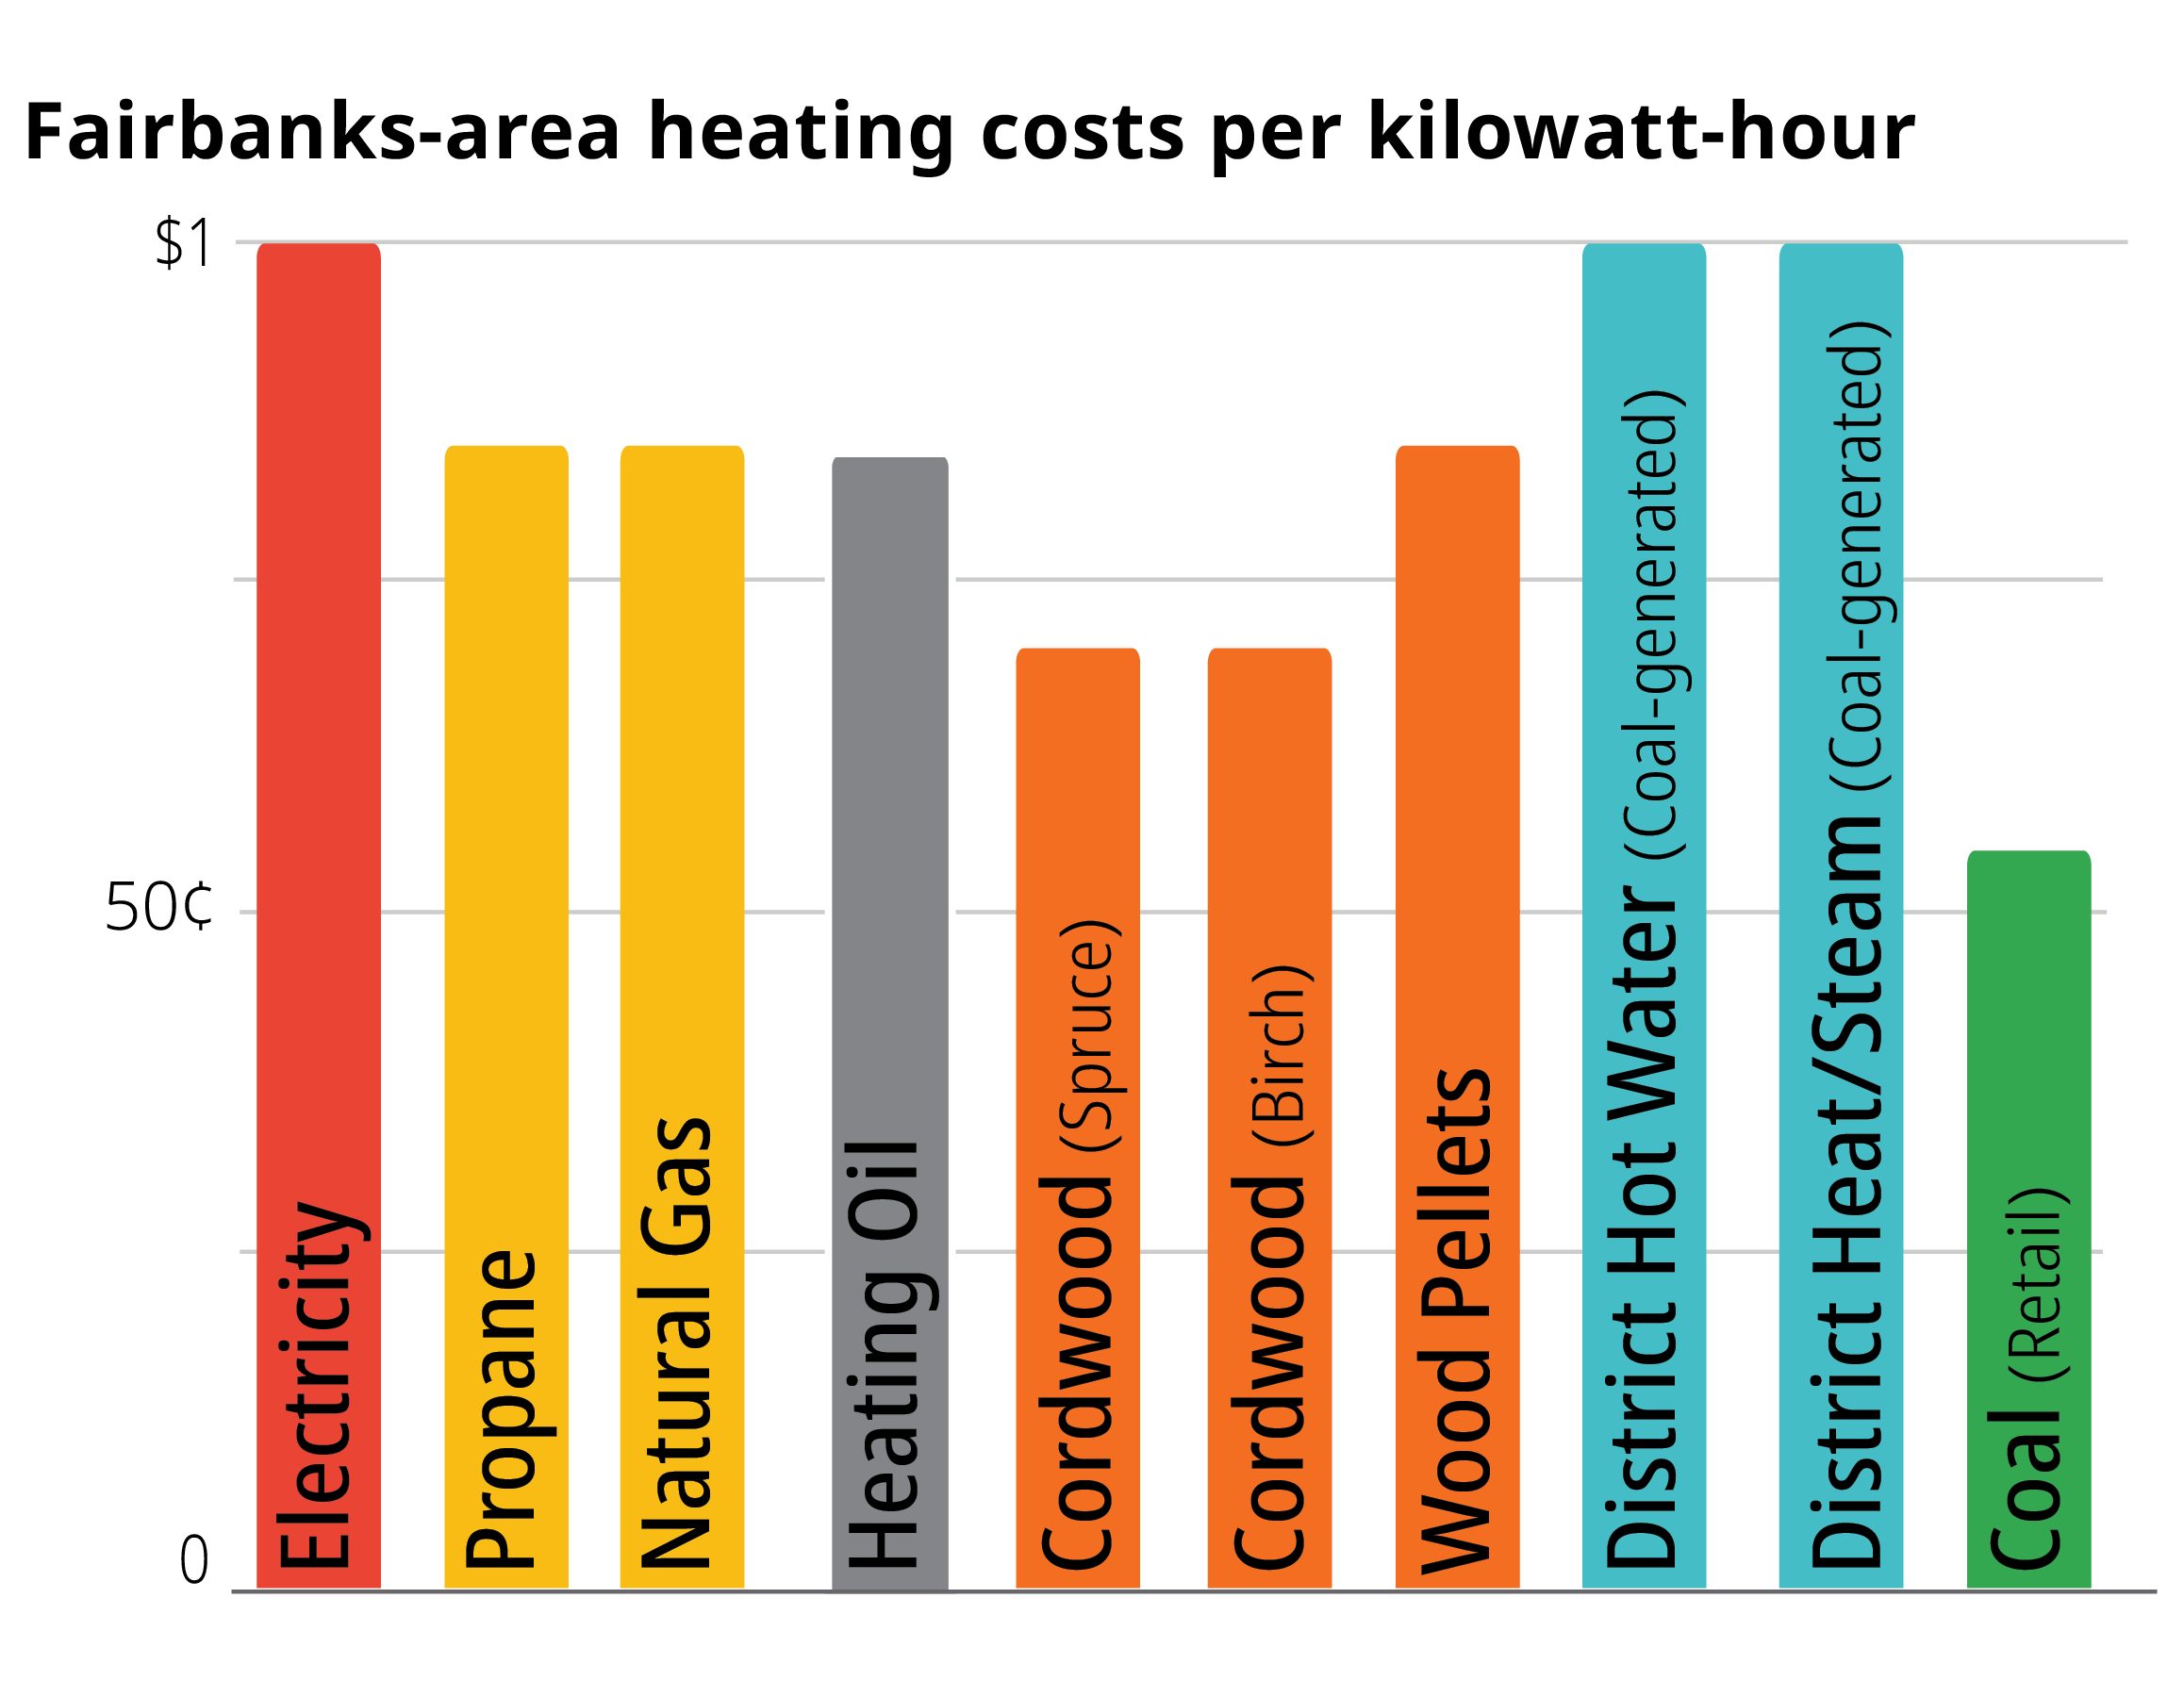
Thanks to the energy density of the combustible rock, coal is a lower-cost source of electricity compared to naphtha or diesel; in 2023, Golden Valley Electric Association averaged $0.07 per kilowatt hour for coal-fired electricity compared to $0.36 for diesel. Yet the region’s residents pay rates more than one and a half times higher than the national average, and the greater need for light and heat in the winter drives the annual energy cost burden to three times the national average.
Coal has the advantage, though, of being stockpiled year-round, assuring utility managers of a stable fuel supply. And the report concludes that shifting away from coal would result in higher electricity prices for the Interior.
This month’s edition of Alaska Trends excavates some more nuggets from that report, showing what powers the Interior grid, how prices compare geographically and among heating fuels, and how the Fairbanks area stays warm.
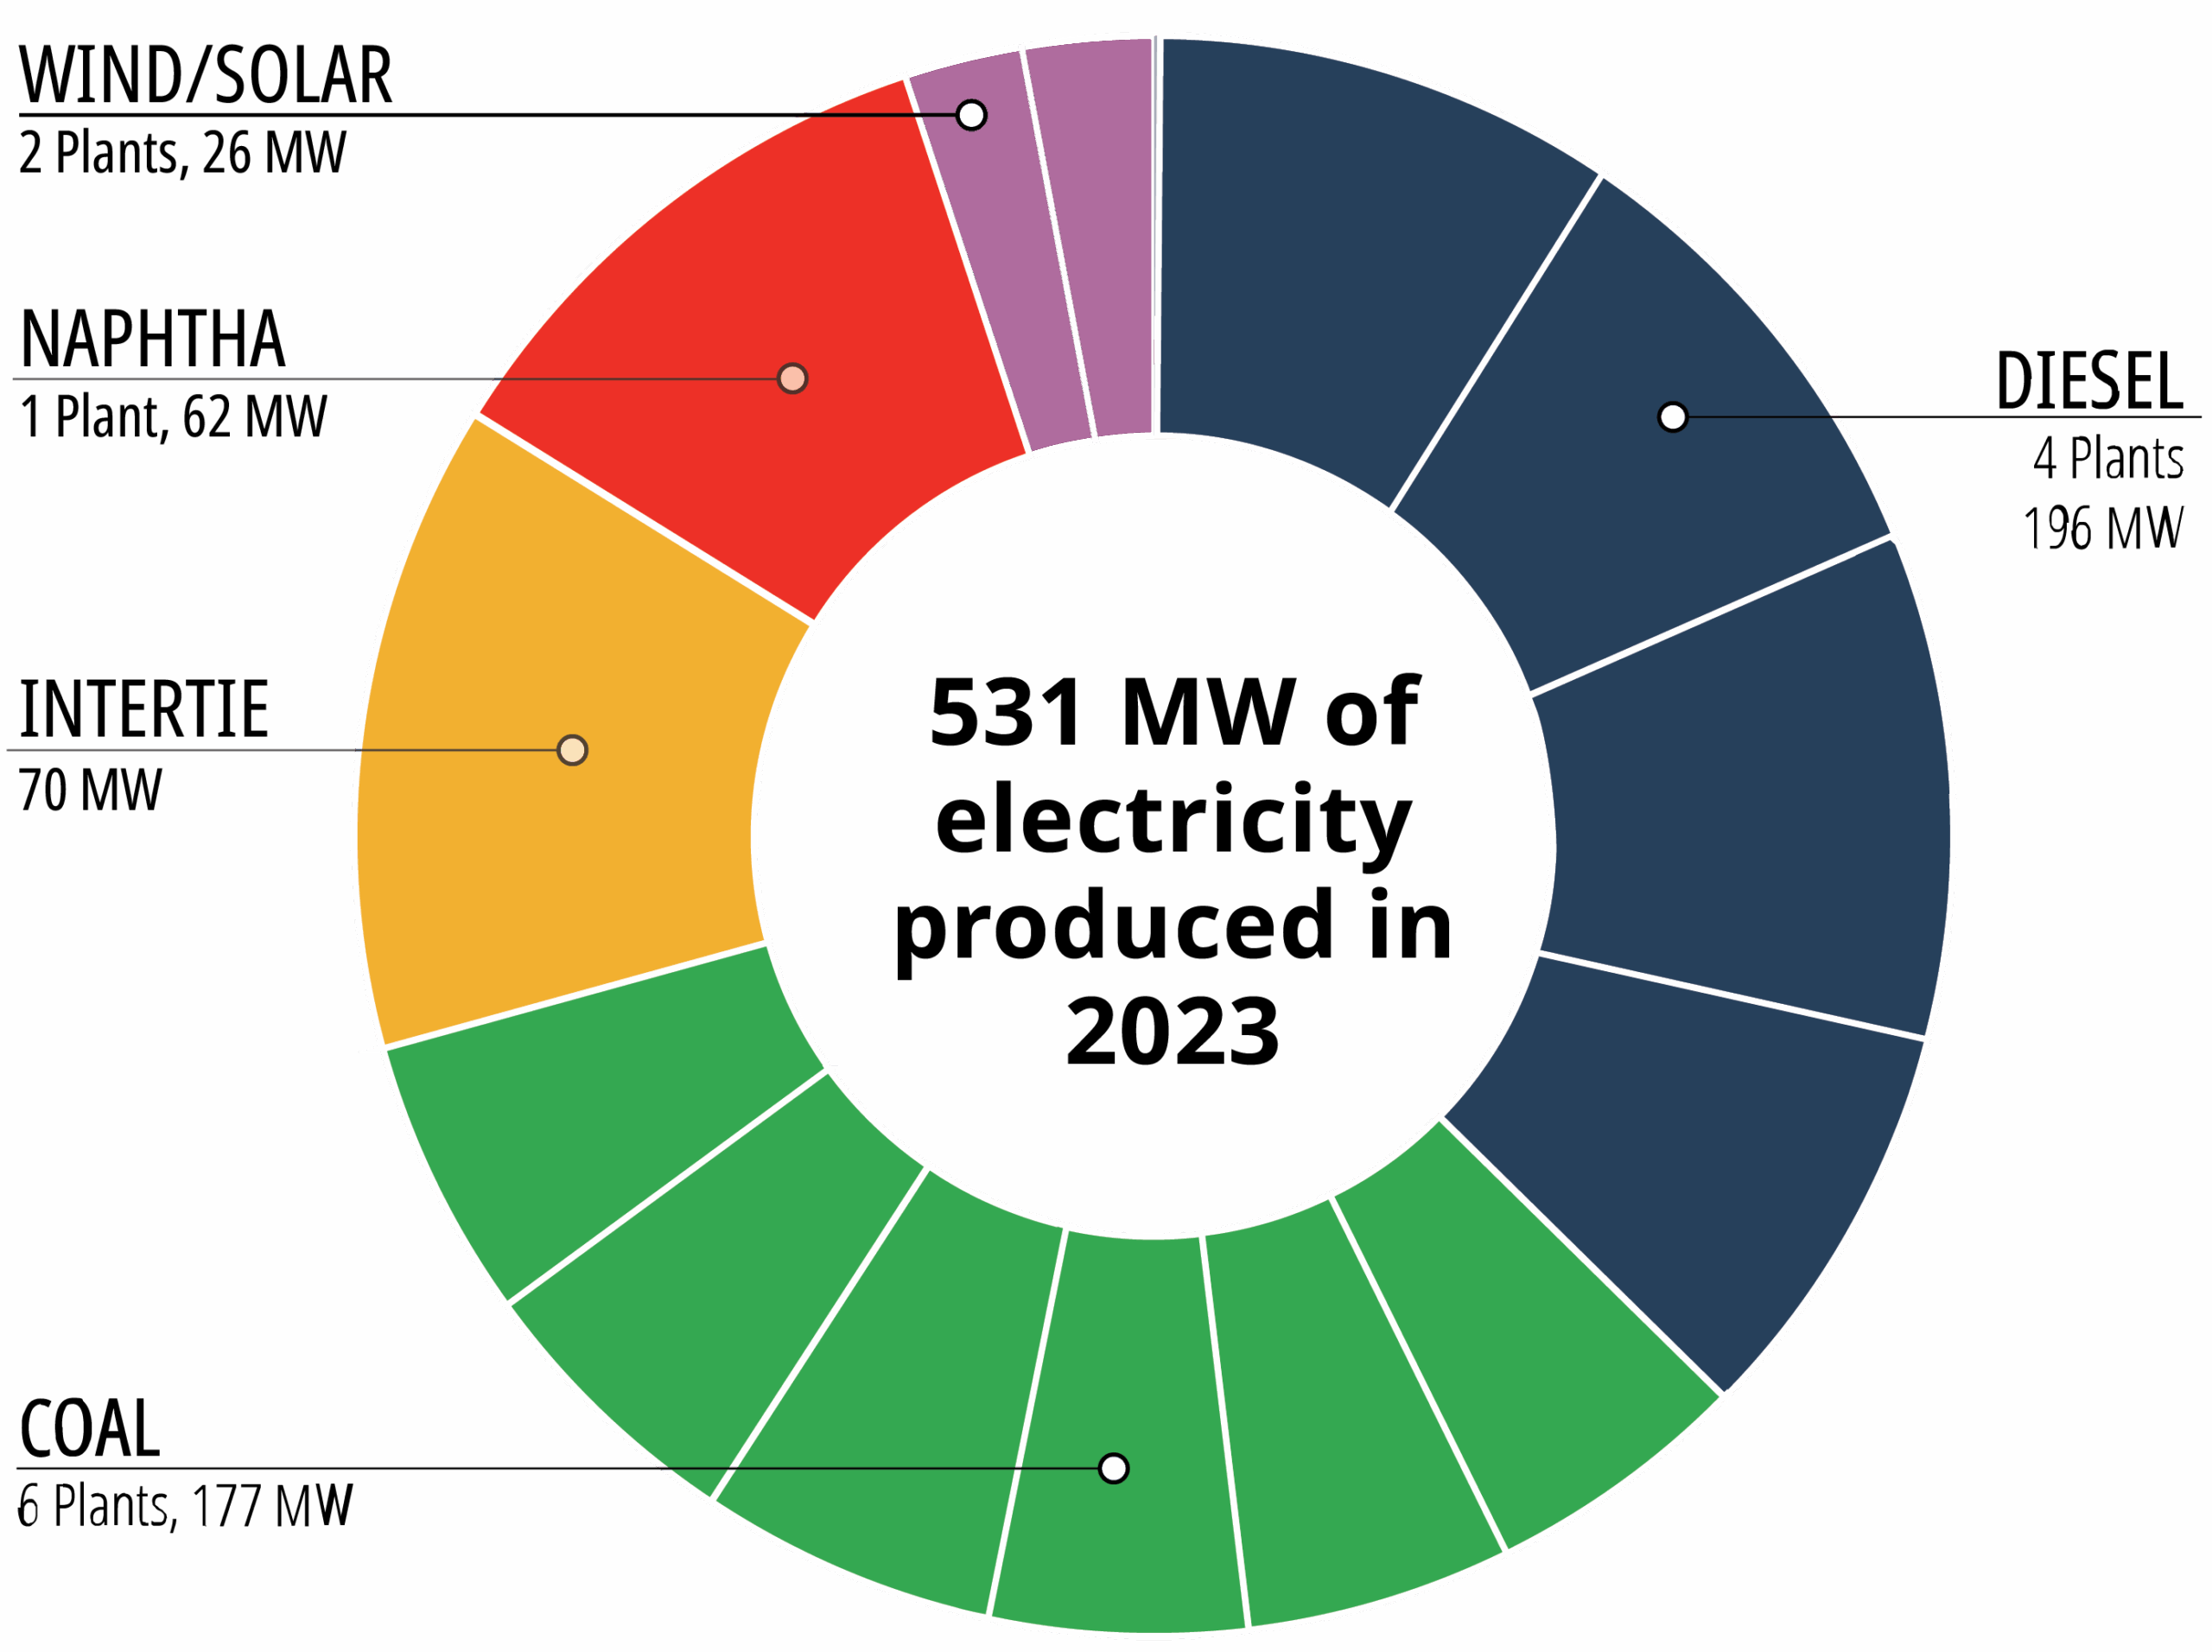
Electricity produced in the Interior in 2023 was generated mainly from fossil fuels such as coal, diesel, and naphtha. Hydroelectric- and natural gas-generated electricity transmitted from Southcentral accounted for one-fifth (20%) of Interior electricity in 2023. Wind and solar resources accounted for 2% of generation.
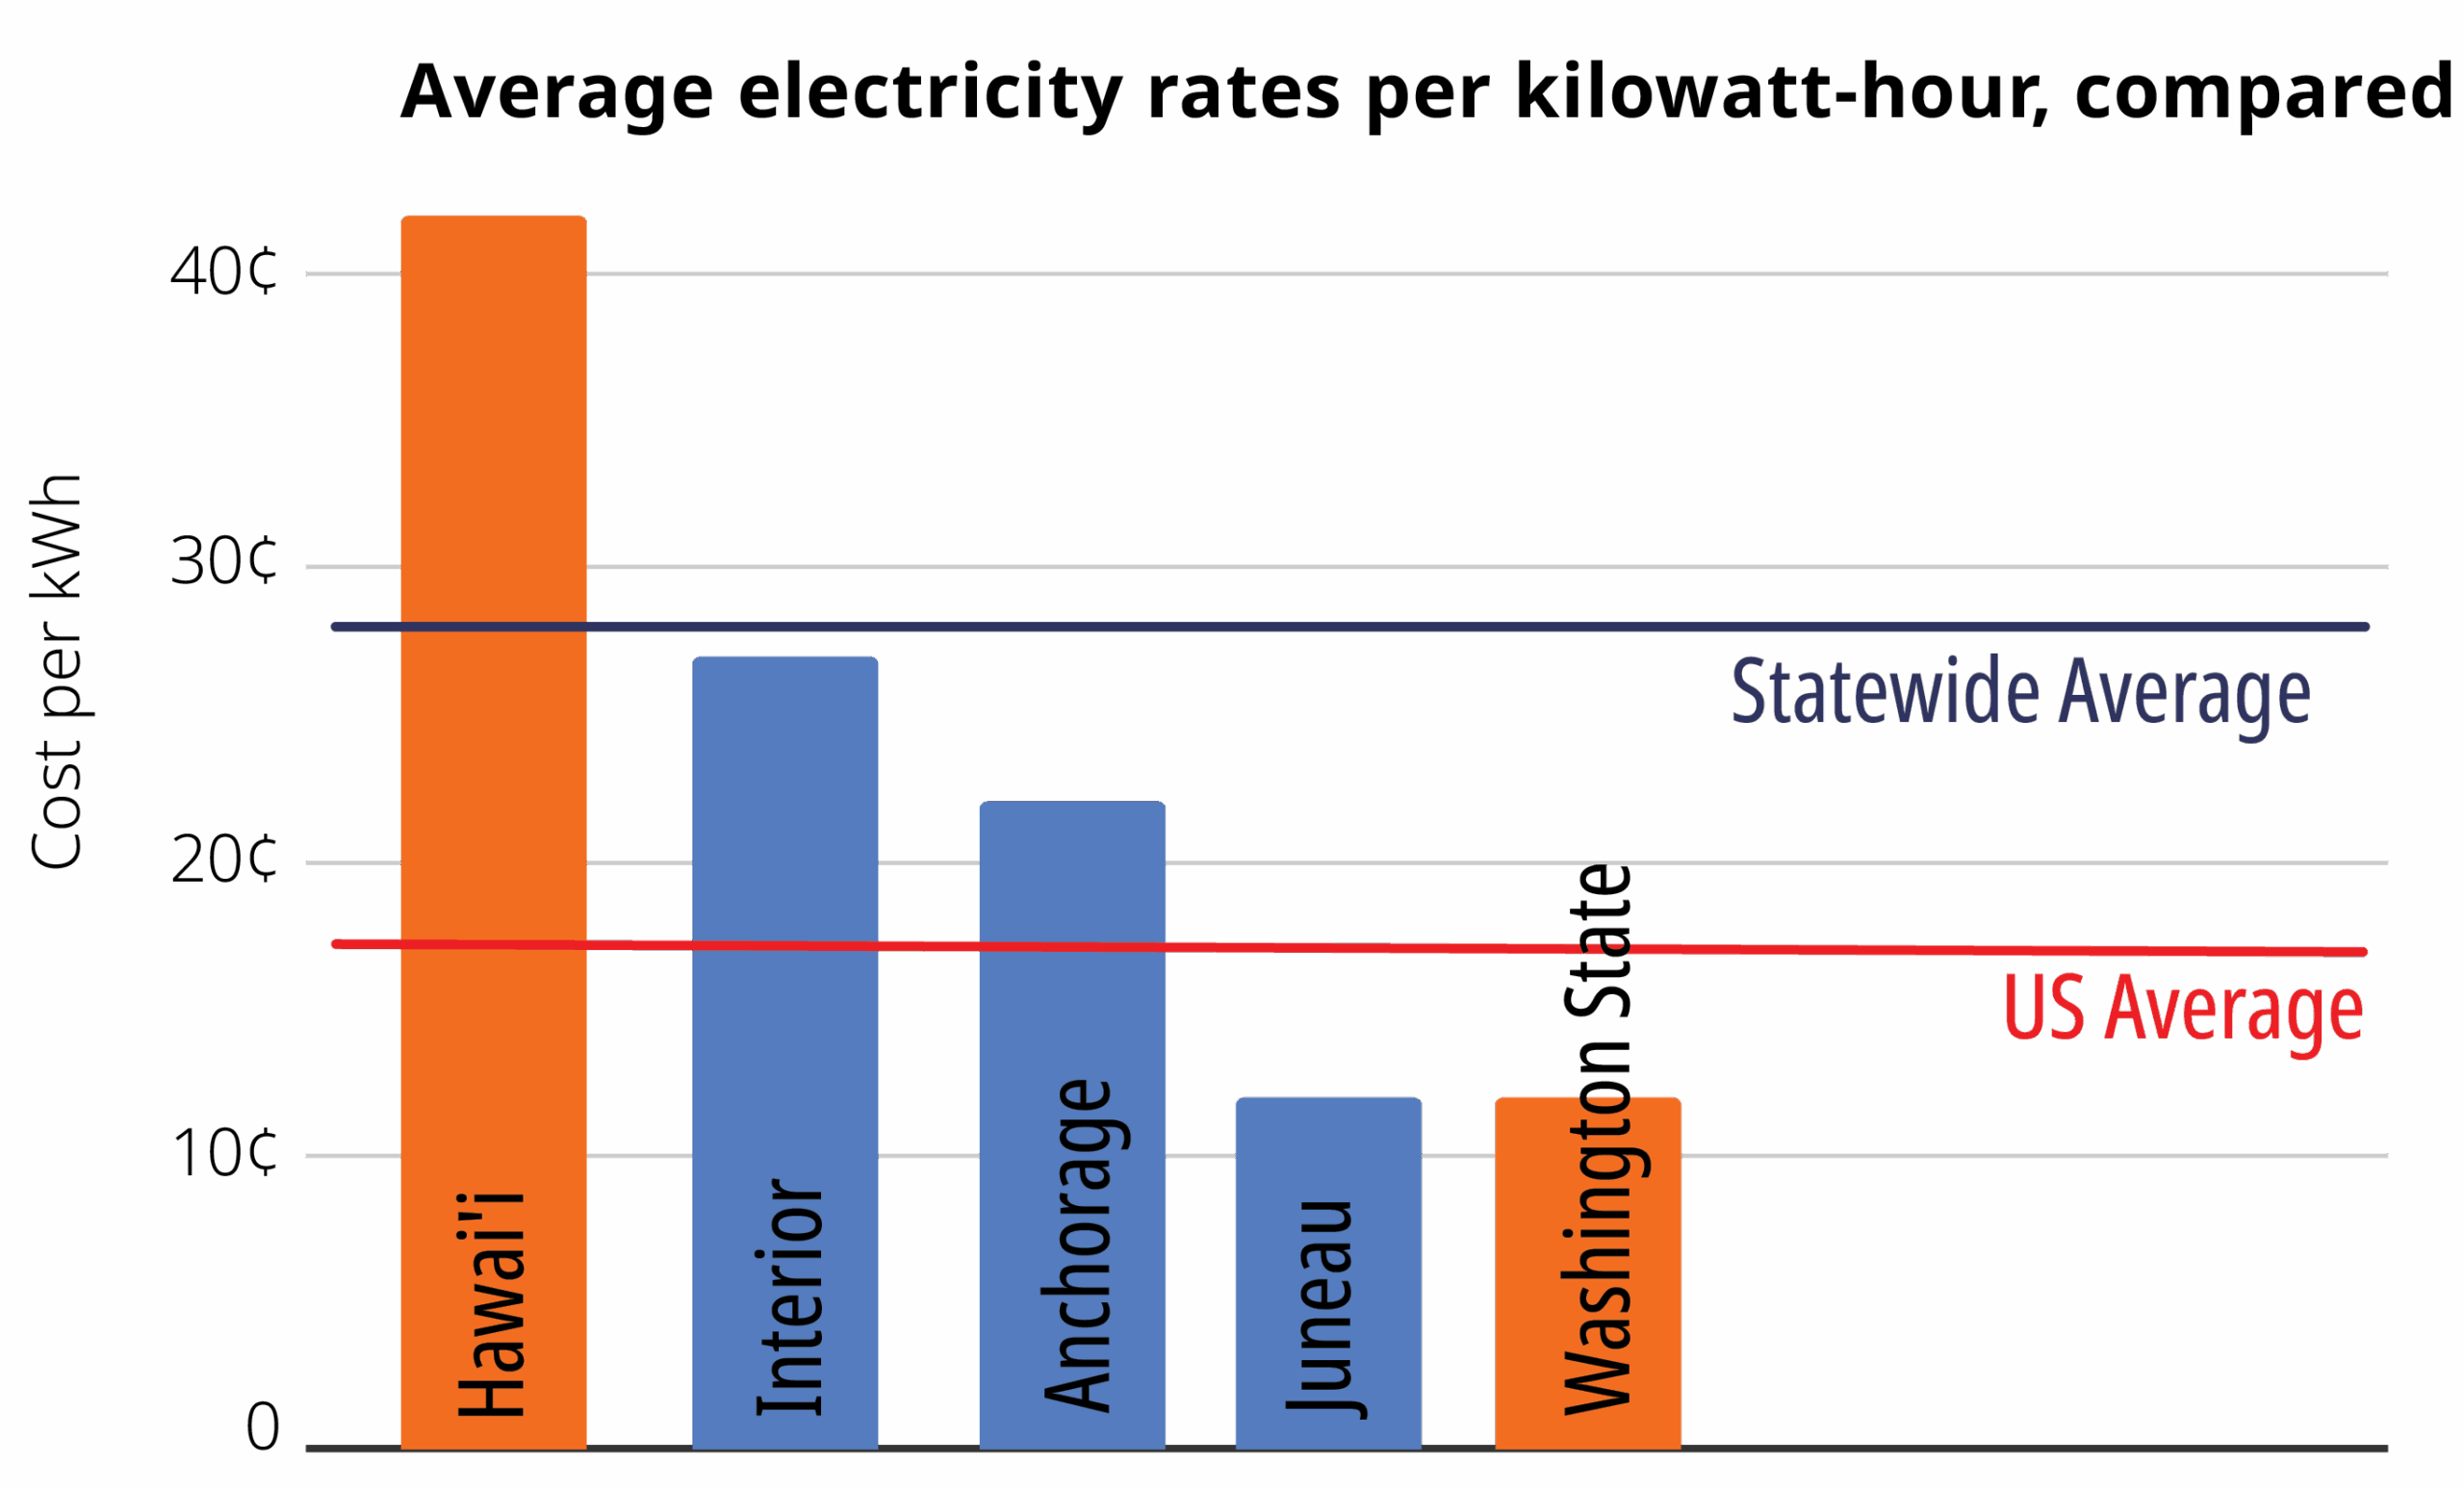
Electricity rates across Alaska are generally high, with the state average electricity rate 65% higher than the US average. In Interior Alaska, residential rates in 2024 were more than 1.5 times higher than the average national rate.
Coal is a substantially lower-cost source of electrical energy compared to other nonvariable sources of power produced in Interior. Hydroelectric- and natural gas-generated energy transmitted to the Interior is limited by capacity of transmission infrastructure and availability of natural gas. Wind and solar sources cannot currently supply the level of stable energy required in the region.
The amount of heat required in a region can be expressed in terms of heating degree days (HDD). This measurement counts the number of degrees below a comfortable temperature (65 ̊ F) a region’s outdoor temperature averages, indicating the demand for heating energy. A region like Hawai’i requires 0 HDD, while Seattle requires 5,000 HDD. Across Alaska, annual HDD requirements range from lows of 7,000 in Southeast up to 20,000 on the North Slope.