Alaska Trends
unny thing about Alaska natural gas: the state has too much in the wrong place. Gas associated with North Slope oil fields has been, for the most part, stranded and isolated from the market. Meanwhile, so much gas used to bubble up from Cook Inlet wells that it could be sold to Japan. Lately, though, not so much; exports ended years ago, and Southcentral utilities are looking at imports to supplement the region’s energy supply.
As reported in this month’s article “LNG In, LNG Out” by Terri Marshall, the idled export terminal in Nikiski is poised to become a lifeline for imported gas. Trans-Foreland Pipeline Company, a unit of Marathon Petroleum Corporation, sought federal permission in 2022 to reverse the valves, so to speak, by the end of 2025. Marathon announced the plan in 2023, and earlier this year the company agreed to hand the facility over to Harvest Alaska, an affiliate of Hilcorp, to finish the job.
Nikiski remains the planned endpoint for a pipeline to export North Slope gas, and in March the project received a major boost. Taiwan’s state-owned energy company, CPC Corporation, signed a letter of intent to buy Alaska gas and invest in development of the pipeline. It wasn’t a binding agreement, but it’s a show of confidence in a project that puts Alaska in competition with gas exporters around the globe.
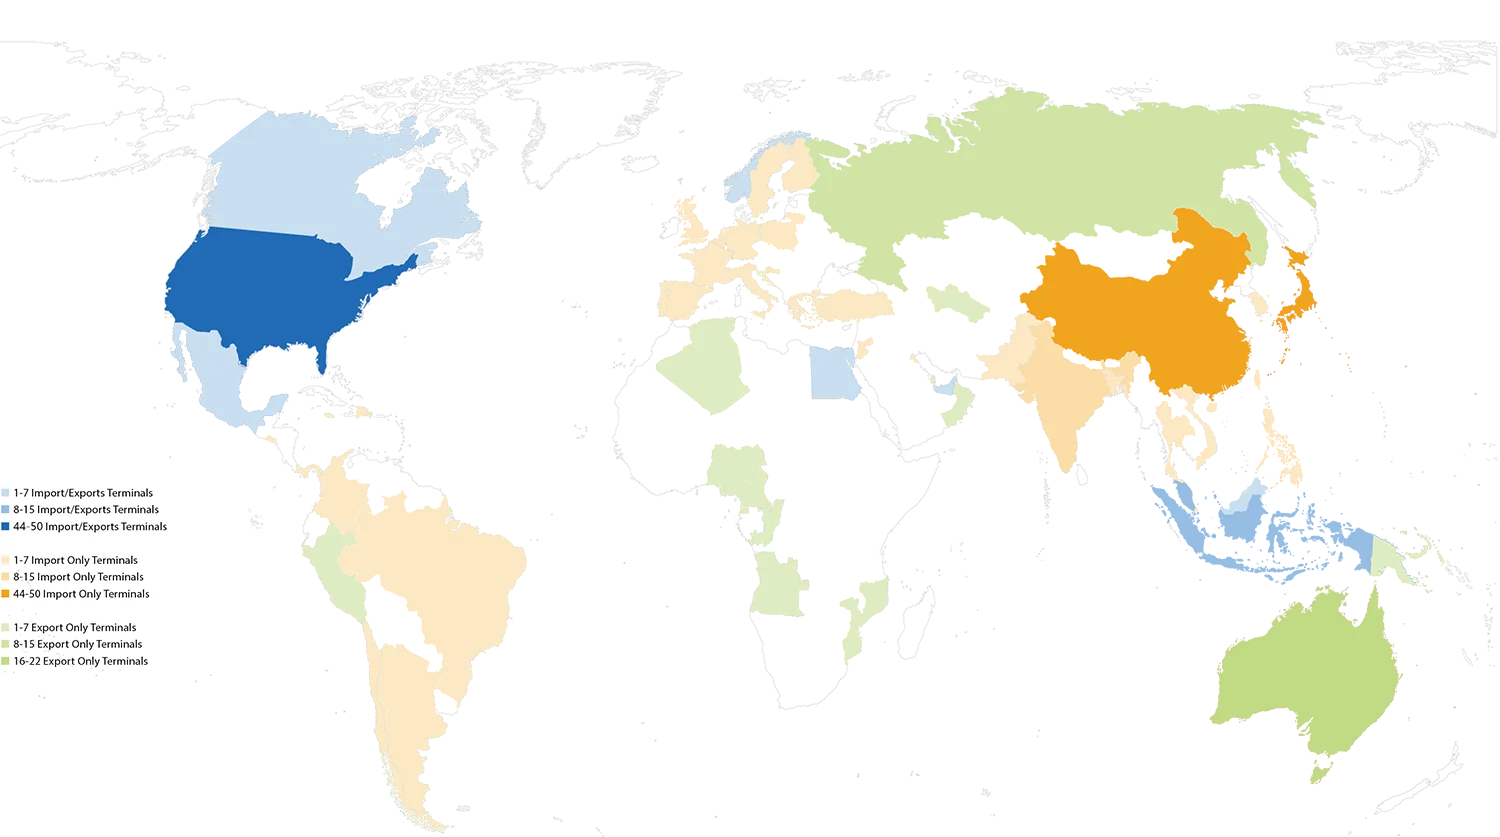
This edition of Alaska Trends scouts the competition by studying Global Energy Monitor’s tracker of liquefaction (export) and regasification (import) infrastructure cross-referenced with a 2024 report from the International Group of Liquified Natural Gas Importers.
“LNG Markets Lookback 2024,” International Group of Liquefied Natural Gas Importers


5 Liquefaction Terminals
Australia (1), Mexico (1), Republic of Congo (1),
Russia (1), USA (1)
14 Regasification Terminals
China (6), Brazil (3), Germany (1), Greece (1),
Italy (1), South Korea (1), Vietnam (1)
Its strong growth is driven by a rebound in industrial production.
