yte by byte, technology is helping the oil and gas industry become more efficient, cost-effective, and safe. Advancements in remote sensing technology and their implementation allow oil and gas companies to collect higher quality data and act more precisely in the field.
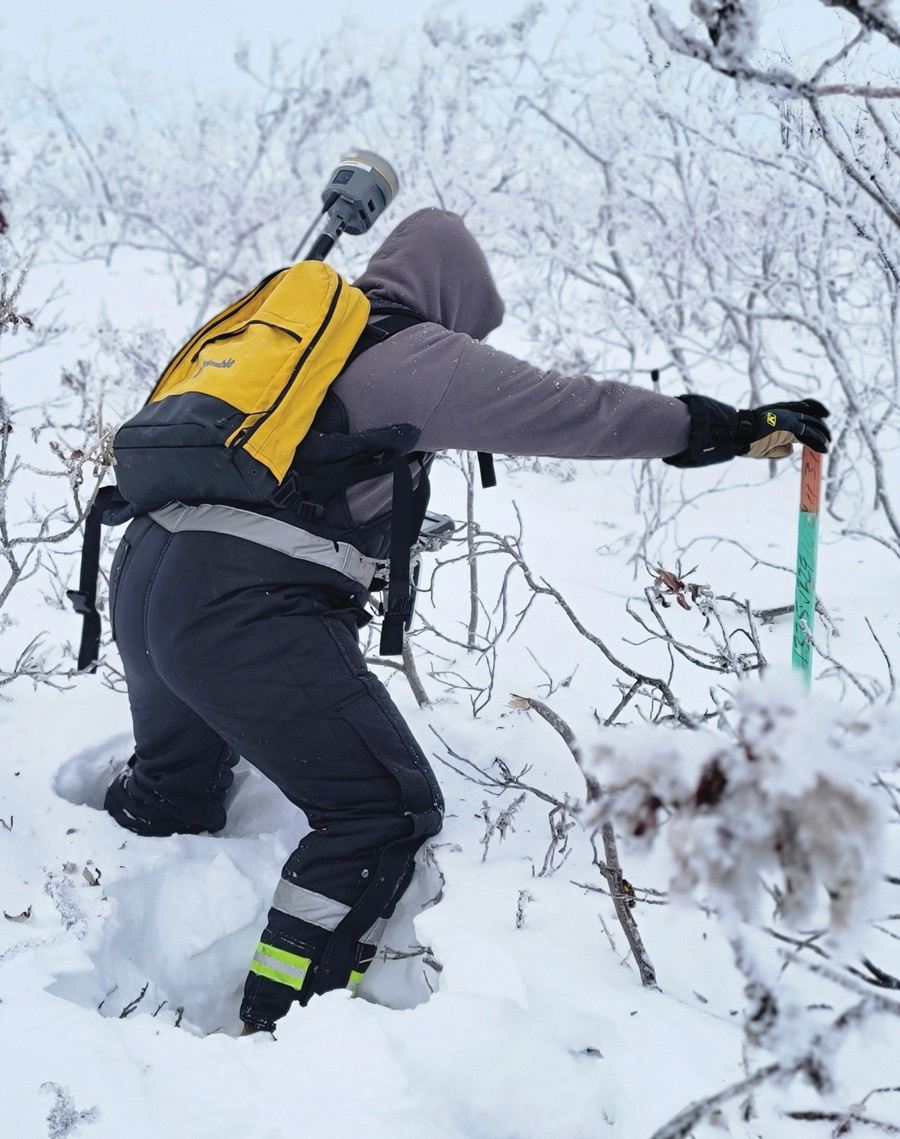
“Using remote sensing, you can collect a lot more data a lot faster,” explains Adam McCullough, the Alaska program manager for NV5 Geospatial, which specializes in light detection and ranging (LIDAR) mapping.
The laser-based remote sensing technology—deployed on autonomous vehicles, fixed-wing aircraft, and helicopters—can provide detailed topographic maps, lake-bottom maps, and vegetation data.
“We do a lot for the oil and gas sector in Alaska,” McCullough says. “Mapping pipelines and infrastructure at high resolution, monitoring changes over time, seeing how pipelines move and subside, looking at how roads are being impacted by landslide risks and geotechnical hazards.”
Having high-resolution mapping is important when a company is trying to model slight year-over-year changes in infrastructure, McCullough says. This is particularly important on the North Slope where the seasonal and yearly changes in permafrost are constantly reshaping the landscape.
“When you can map down to a couple centimeters, you can really start looking at year over year changes and trajectories,” McCullough says.
If, for example, the mapping shows that a section of pipeline has subsided several centimeters in the last few years, a company can deploy a maintenance team to that area to prevent any further erosion or impacts to the infrastructure, McCullough explains.
“You don’t want a pipe to burst or your facility to fall into a pond developing up on the Slope,” McCullough says. “It’s really a way of using the [increased] precision to model the entire network of infrastructure—hundreds of miles of pipes and gravel roads and facilities up on the Slope—and pinpoint the areas that are being put at risk.”
“[LIDAR] is a cheaper unit cost,” McCullough says, noting that what used to take an entire field season can be completed in greater detail in a week or two. “The processing becomes a lot faster, so the reporting becomes a little more immediate, and it becomes highly repeatable.”
By running the same data collection processes year after year, clients can see changes in the landscape and infrastructure in greater precision. The highly accurate data also allows them to better model future changes.
“You’re doing things smarter with remote sensing technology,” McCullough says.
Previously, teams required complicated logistics, including bear guards, to collect this type of data in the field.
“They’d spend all summer on foot, measuring places where there’s potential change and risk,” McCullough says. “You’re talking about hundreds of thousands of dollars in field work and a slower data gathering process, a slower data analysis process, and a not very repeatable process.”
NV5 Geospatial

NV5 Geospatial
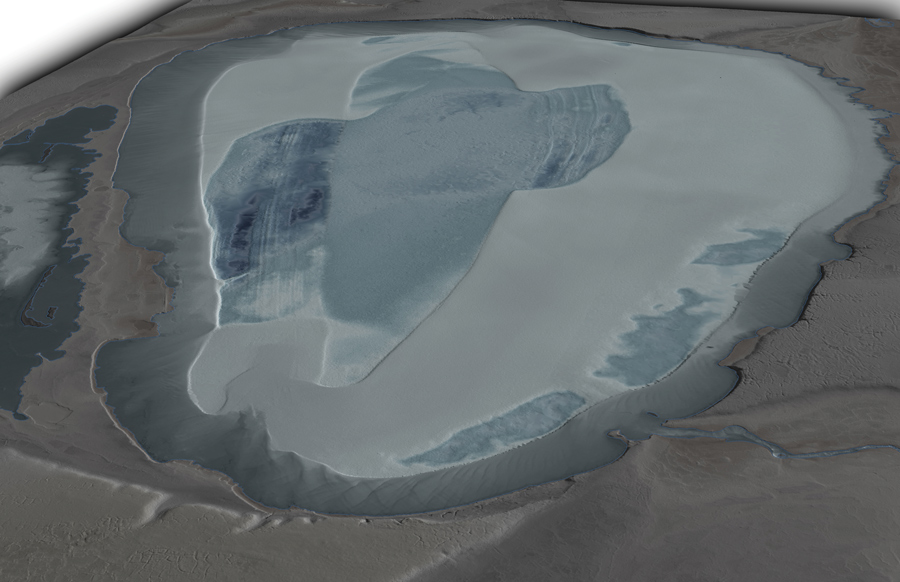
Traditionally, companies would bring a Zodiac boat with an outboard motor to a remote destination by helicopter and then map the bottom of the lake with sonar. Using this method, a team could survey about two lakes a day, explains McCullough.
“It would be extremely expensive with all of the helicopter time and boots on the ground and all the permits required,” McCullough says.
Technological advancements in remote sensing equipment now allow McCullough and his team to fly over lakes and ponds on the North Slope using a specialized LIDAR technology known as topobathymetric LIDAR.
“With that, we can map through the water column down to the bottom,” McCullough says. “We can map in much higher precision, hundreds of lakes a day, as opposed to two a day.”
Topobathymetric LIDAR is also used to collect data on rivers and streams for understanding the habitat of overwintering fish. These data help meet reporting requirements at the state and federal level, McCullough says.
Additionally, matching LIDAR with aerial imagery provides ecological data for development impact assessments, McCullough explains.
“We do a lot of vegetation and wetland health assessment,” McCullough says. By imaging vegetation using visual and infrared spectra, the greens associated with chlorophyll shift into the infrared band, which displays important plant health characteristics.
“You pick up a lot of really intense nuance in the growth patterns of vegetation,” he says.
Plant ecologists who specialize in analyzing this data can track the health of these areas. This is done by comparing a pre-development baseline map with a post-development map.
“The weather is our biggest challenge,” McCullough says.
In order to map an area with LIDAR or imagery, McCullough and his team need windows of time without fog or clouds—a rarity on the North Slope. Ten to fifteen years ago, two to three weeks of cooperative sunny weather on the Slope in the summer wasn’t unusual. That’s changed.
“The last few years have been a lot different,” McCullough says. “Last year, we only had three really workable sunny days the entire summer. It was one of our worst seasons.”
Unlike LIDAR, bad weather is no obstacle for radar technology used in the oil and gas industry.
Synthetic Aperture Radar (SAR) on satellites is particularly useful to the oil and gas industry because the technology is weather independent, sunlight independent, and operates 24/7, explains Franz Meyer, a professor of remote sensing at UAF and chief scientist of the Alaska Satellite Facility.
While spaceborne SAR has been around since the ‘70s, technological advancements in the field continue to open doors to a better understanding of the world.
“It makes the dataset very repeatable,” Meyer says. “If we take an image every ten days from the same spot in space, the image, in theory, should look the same because we have the same amount of energy we sent in from the exact same spot.”
The one exception is when something has changed on the ground. SAR on satellites show changes in the Earth’s surface caused by permafrost as well as oil production. They can also help scientists recognize landslides, waterway expansions, and other changes—big and small—over a period of years or days.
Meyer is particularly excited about the NASA and Indian Space Research Organization collaborative mission NISAR, which will result in vast amounts of additional geospatial data being housed at the Alaska Satellite Facility. Scheduled to launch in early 2024, the satellite will provide all-weather, day/night imaging of nearly the entire land and ice masses of the Earth.
“NISAR’s orbiting radars will image at resolutions of 5 to 10 meters to identify and track subtle movement of the Earth’s land and its sea ice and even provide information about what is happening below the surface,” the NISAR website explains.
Satellite-based radar imagery can characterize how the Earth’s surface deforms due to actively managed oil and water reservoirs. Even more important to oil and gas companies on the North Slope is information about changes in permafrost.
NV5 Geospatial
NV5 Geospatial
Meyer explains that NISAR will provide an incredibly high-quality basemap for interested parties, including oil and gas companies.
“We literally will have a useful dataset every twelve days, which is not something you get from optical data,” Meyer says. “You can use the free datasets to sort of figure out where it’s most important to acquire potentially more costly, higher-resolution imagery that you need to track down very localized signals and patterns.”
“We’re creating images for our clients, whether it’s for reservoir development or for exploration work,” explains SAExploration President and CEO Forrest Burkholder. “We’re doing a lot of reservoir management work, which gives a refined image to make sure that they’re efficiently drilling out their prospect.”
The technological advancement in this type of subsurface mapping in the last decade is comparable to the difference between black-and-white television and a modern 4k LED monitor.
“You’re able to have a higher resolution of image, which allows our customers to understand what’s going on in the subsurface better, so that when they’re doing their drilling, they’re hitting their targets,” Burkholder says. “From that perspective, we dramatically reduce their costs.”
Working with BP, SAExploration adapted high-resolution seismic technology developed for the Middle East. The company also deploys autonomous nodes—a device smaller than a coffee can—in the survey area instead of hundreds of miles of cables.
“You plant it and it records autonomously, twenty-four hours a day, seven days a week, and it’ll do that for sixty days, if you needed to,” Burkholder says.
What the device is recording is vibrations bouncing off subterranean formations and features to create an image of what’s below the surface.
Before the autonomous nodes were used, a team would lay out hundreds of miles of ground cable that were then connected to boxes wired to geophone sensors. It was slower to set up and more difficult to maintain. The team was usually able to complete a maximum of 100,000 vibrator pad (VP) data points a season.
By using the nodes and source-driven shooting, SAExploration is now able to collect a million VPs in about two months.
“You’re not actually covering more area, you’re making a better picture,” Burkholder says. This is possible because the company is able to put out a higher density of nodes, which provides a dramatically better picture.
SAExploration
SAExploration
SAExploration
SAExploration
“It was an anomaly, but on the old dataset they couldn’t properly see that. On the new dataset, they could,” Burkholder says. “So, instead of abandoning the well as a dry hole, they were able to complete drilling and put a well into production on a 40-year-old reservoir.”
Getting rid of the cables was really the key, Burkholder says.
“Our efficiencies went up quite dramatically with nodes,” Burkholder says, noting that this increased the efficiency of the vibrators, large vehicles that shake the ground.
Even the largest vibrators SAExploration has—80,000 pounds—aren’t comparable to standing next to a train, he says. Yet the autonomous nodes detect those vibrations and paint a vivid picture of underground features. The nodes are also cheaper to operate. Previously, if a snow drift covered the webbing of cables, a team would dig it out, which would delay the project and increase costs. Breaks in the line also caused delays.
With a cable system, a 3 percent sensor failure rate was considered acceptable—though SAExploration usually kept it to 1.5 percent. The failure rate with the nodes is typically less half a percent, Burkholder says.
“All those cost savings and all of those efficiencies have been passed on to the client,” Burkholder says. “But the benefits that they realize, because their data is so much better, is far greater, because there are fewer dry wells and more efficient drilling.”
The efficiencies offered by new developments in remote sensing, such as clearer images of below-ground resources and the risks to infrastructure, as well as the ability to collect the data more cheaply, all help the bottom line of operating Alaska’s oil fields. ![]()