Alaska Trends
asoline prices fluctuate in direct response to the price of the crude oil it’s made from. Oh boy, do they fluctuate. Not so, however, the employment of workers who supply those fossil fuels. Not in Alaska, at least. The number of oil industry jobs has declined fairly steadily since the 2014 oil price crash, even though prices themselves have gone up, then down, then up again.
The oil and gas industry remains the primary economic activity of Alaska, no question about it. No question, too, that the industry looks much different today than it did just seven years ago, with half as many workers on the payroll.
Production has not shrunk by half, though. The volume of crude in the Trans Alaska Pipeline System is down, yes, but the decrease is closer to 8 percent than 50.
Clearly, the fewer remaining oil workers are more productive than ever, thanks to new tools and techniques. For example, this month’s article “Eyes on the Sky, Ears on the Ground” describes advancements in remote sensing that help oil companies pinpoint and monitor their precious resources. By helping workers do more with less, technological advances reduce costs for exploration, development, and production, thus sustaining the industry as Alaska’s cash cow.
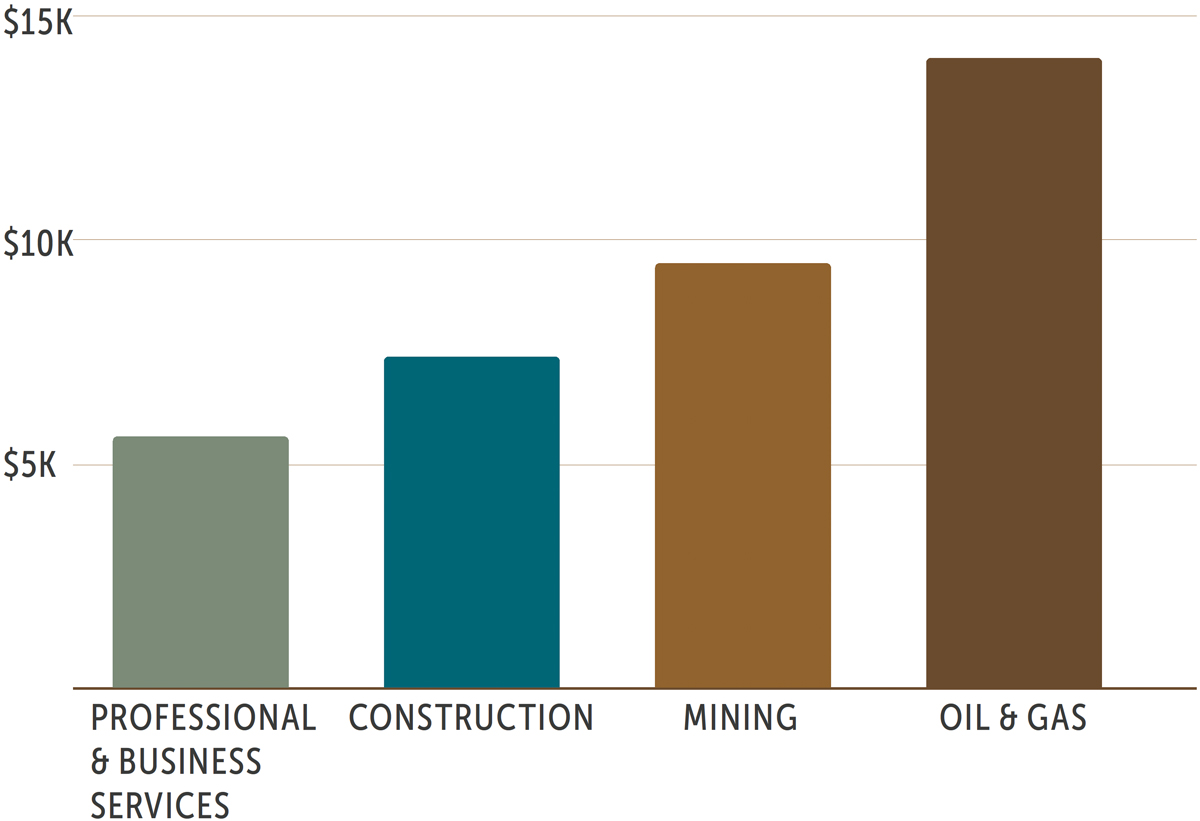
Lower costs usually mean smaller crews, though, and in turn less work for the allied services that support those crews. Personnel is a huge component of oil industry expenses. Those hefty paychecks go a long way toward attracting workers willing to withstand the harsh conditions and grueling schedule. Not to mention compensating them for expertise they could, if they chose, apply to oil fields anywhere else in the world.
This month’s Alaska Trends puts on green eyeshades to examine the flow of oil industry money through the state economy and what’s changed, or not, since at least the turning point of 2014.
US Energy Information Administration: Alaska North Slope Purchase Price
Alaska Department of Labor & Workforce Development: Alaska Monthly Employment Statistics
Alaska Department of Revenue, Tax Division: Spring 2022 Revenue Forecast; Revenue Sources Book, 2015
Livescience.com: First Commercial Drone Use Approved in US
Lynden: How ‘The Beast’ Moved from Alberta to the North Slope
National Energy Technology Laboratory: First ever field pilot on Alaska’s north slope to validate the use of polymer floods for heavy oil EOR
$3B
$1.7B

$2.4B tax revenue
$709M royalty revenue
$3B
$1.7B
$2.4B tax revenue
$709M royalty revenue


$19,810 is the average monthly wage in the Oil & Gas Extraction job category
$9,354 is the average monthly wage in the North Slope Borough
per day in 2014 vs 486,100 in 2021