Alaska Trends

W

hile studying political theory and philosophy at Hunter College in New York City, Leah Moss sold apples for a living. She then helped start a restaurant in Texas, and when she moved north, she became the spokesperson for the Alaska Food Policy Council. Although she’s left that position, Moss continues the outreach work. Her article “Collaboration at the Core” reports on the council’s working groups in the areas of advocacy, hydroponics, traditional foods, food waste, and food hubs.

The council is a perpetual nonprofit, whereas the Alaska Food Strategy Task Force was established in 2022 to inform the Alaska Legislature. The top recommendation of the task force’s 2024 report was to elevate the Division of Agriculture within the Alaska Department of Natural Resources to its own cabinet-level Department of Agriculture and to consolidate relevant offices from other departments. In March, the Alaska House and Senate blocked the governor’s executive order to establish the department, but lawmakers were open to pursuing the task force’s recommendation by statute.

Appendix E of the task force report cites a federal census of agriculture published in February 2024, using data from 2022. It shows that the top crops in Alaska are hay, cattle, and flowers. The median size of farms is 12 acres; half of farms are smaller than 12 acres, but some very large farms skew the average size to 742 acres. Just 45 percent of farmers work at it full time; the majority hold day jobs elsewhere. And busy, busy bees produced 28,941 pounds of honey in 2022, from 597 colonies around Alaska.

This edition of Alaska Trends reaps some other findings from the census.

SOURCE: “2022 Census of Agriculture – State Data” by US Department of Agriculture, National Agricultural Statistics Service
483,211 farms accepted government payouts nationally. 185 of those farms were in Alaska.
The total value of products sold by Alaska farms is $90.9M.
Vertical bar chart comparing crop and livestock values. A tan wheat icon represents crops at $39.7 million, including nursery and greenhouse products. An orange chicken icon represents livestock at $51.2 million, including poultry and related products.
Total Income From Farm-Related Sources
Vertical bar graph showing agricultural data by state. California and Texas lead with nearly $2 billion each, followed by Iowa and Nebraska. Alaska appears on the far left with the lowest value.
Icon illustration of a red and orange barn with a silo, sitting above rows of stylized pink crops.
Of the 2M farms in the US, 1,173 are in Alaska.
1 farm for every 631 alaskans.
Alaska has 22 barley farms, 6 oat farms, and 3 wheat farms.
Alaska has 80 orchards.
10% of farms in Alaska produce over $100K in product.
Stylized orange icon of three rows of root vegetables resembling carrots, each with green tops.
Alaska Farms Raising Poultry and Livestock
Donut chart illustrating types of livestock. Segments include Layers (chickens), Broilers & others, Cattle & Calves, Beef Cows, Milk Cows, Hogs & Pigs, and Sheep & Lambs. A chicken sitting on eggs represents the “Layers” category.
Alaska has 72,708 acres of cropland. 36,211 acres are harvested.
Alaska has 745 acres of vegetable cropland.

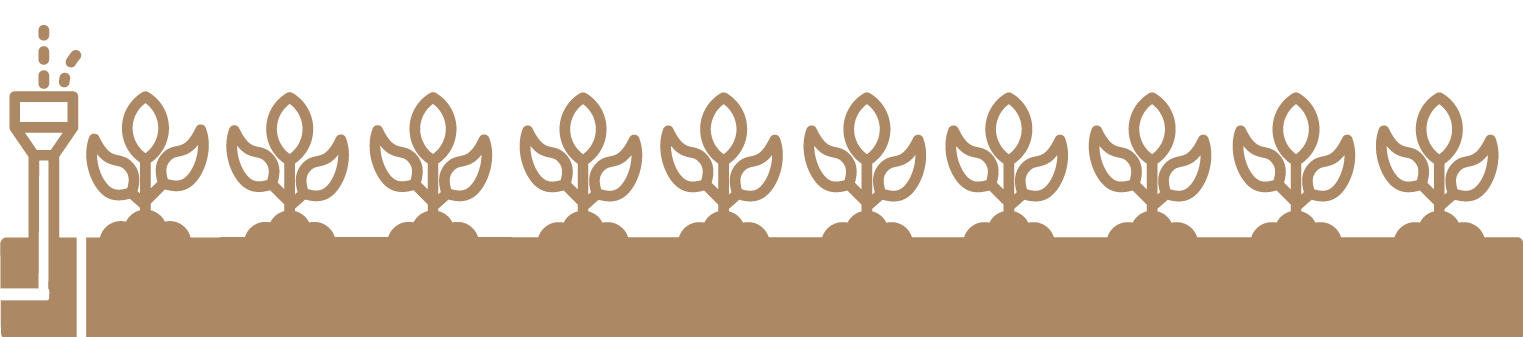
321 acres are planted with potatoes.

Cartoon illustration of a smiling brown potato character holding a pitchfork. The potato wears a blue hat and has simple eyes, mouth, and arms.
Alaska Farms by Acreage
Horizontal bar chart showing the number of farms by acreage. Most farms are in the 1–9 acre category (about 500 farms), followed by 10–49 acres. Larger farms of 500 acres or more have significantly lower numbers.
There are 869,852 acres of farmland in Alaska.

Less than 1% of that land is irrigated.

Horizontal illustration of an irrigation sprinkler spraying water over a long row of brown crops with two leaves each.