Alaska Trends
irplanes were barely a decade old when the technology arrived in Alaska’s sky. The first flight took place in 1913, when early adopters James and Lily Martin shipped a biplane via the Klondike and assembled it in Fairbanks as part of a demonstration tour.
About a decade after that, in the summer of 1924, Noel Wien completed the first airplane flight from Anchorage to Fairbanks. This month marks the centennial of Wien’s first Bush flight to miners in Livengood, and the same year saw Carl Ben Eielson deliver the first airmail in Alaska from Fairbanks to McGrath. Air travel evolved hand-in-hand with the development of Alaska as a US territory.
Today, aviation contributes about $3.8 billion to the state economy, according to the Alaska Division of Statewide Aviation. The number of licensed pilots, as a portion of the entire population, is six times the rate in the rest of the country, and Alaska has sixteen times as many aircraft per capita.
The Federal Aviation Administration (FAA) counted 2 million “enplanements” by air passengers in Alaska for fiscal year (FY) 2021, or 2.9 times the population of the entire state; the national rate of enplanements was just 1.1 times US population. Alaska has 391 public-use airports—more than Texas or California—plus nearly as many private and military landing areas. Pilots used FAA flight service stations 1,406,761 times in FY2021, or nearly 4,000 activities every day.
This month’s article “Regional Turbulence” by Alexandra Kay spotlights the importance of rural airports and the state’s 309 certificated carriers that connect them. The instrument panel for this edition of Alaska Trends displays more facts for frequent flyers. Up, up, and away!
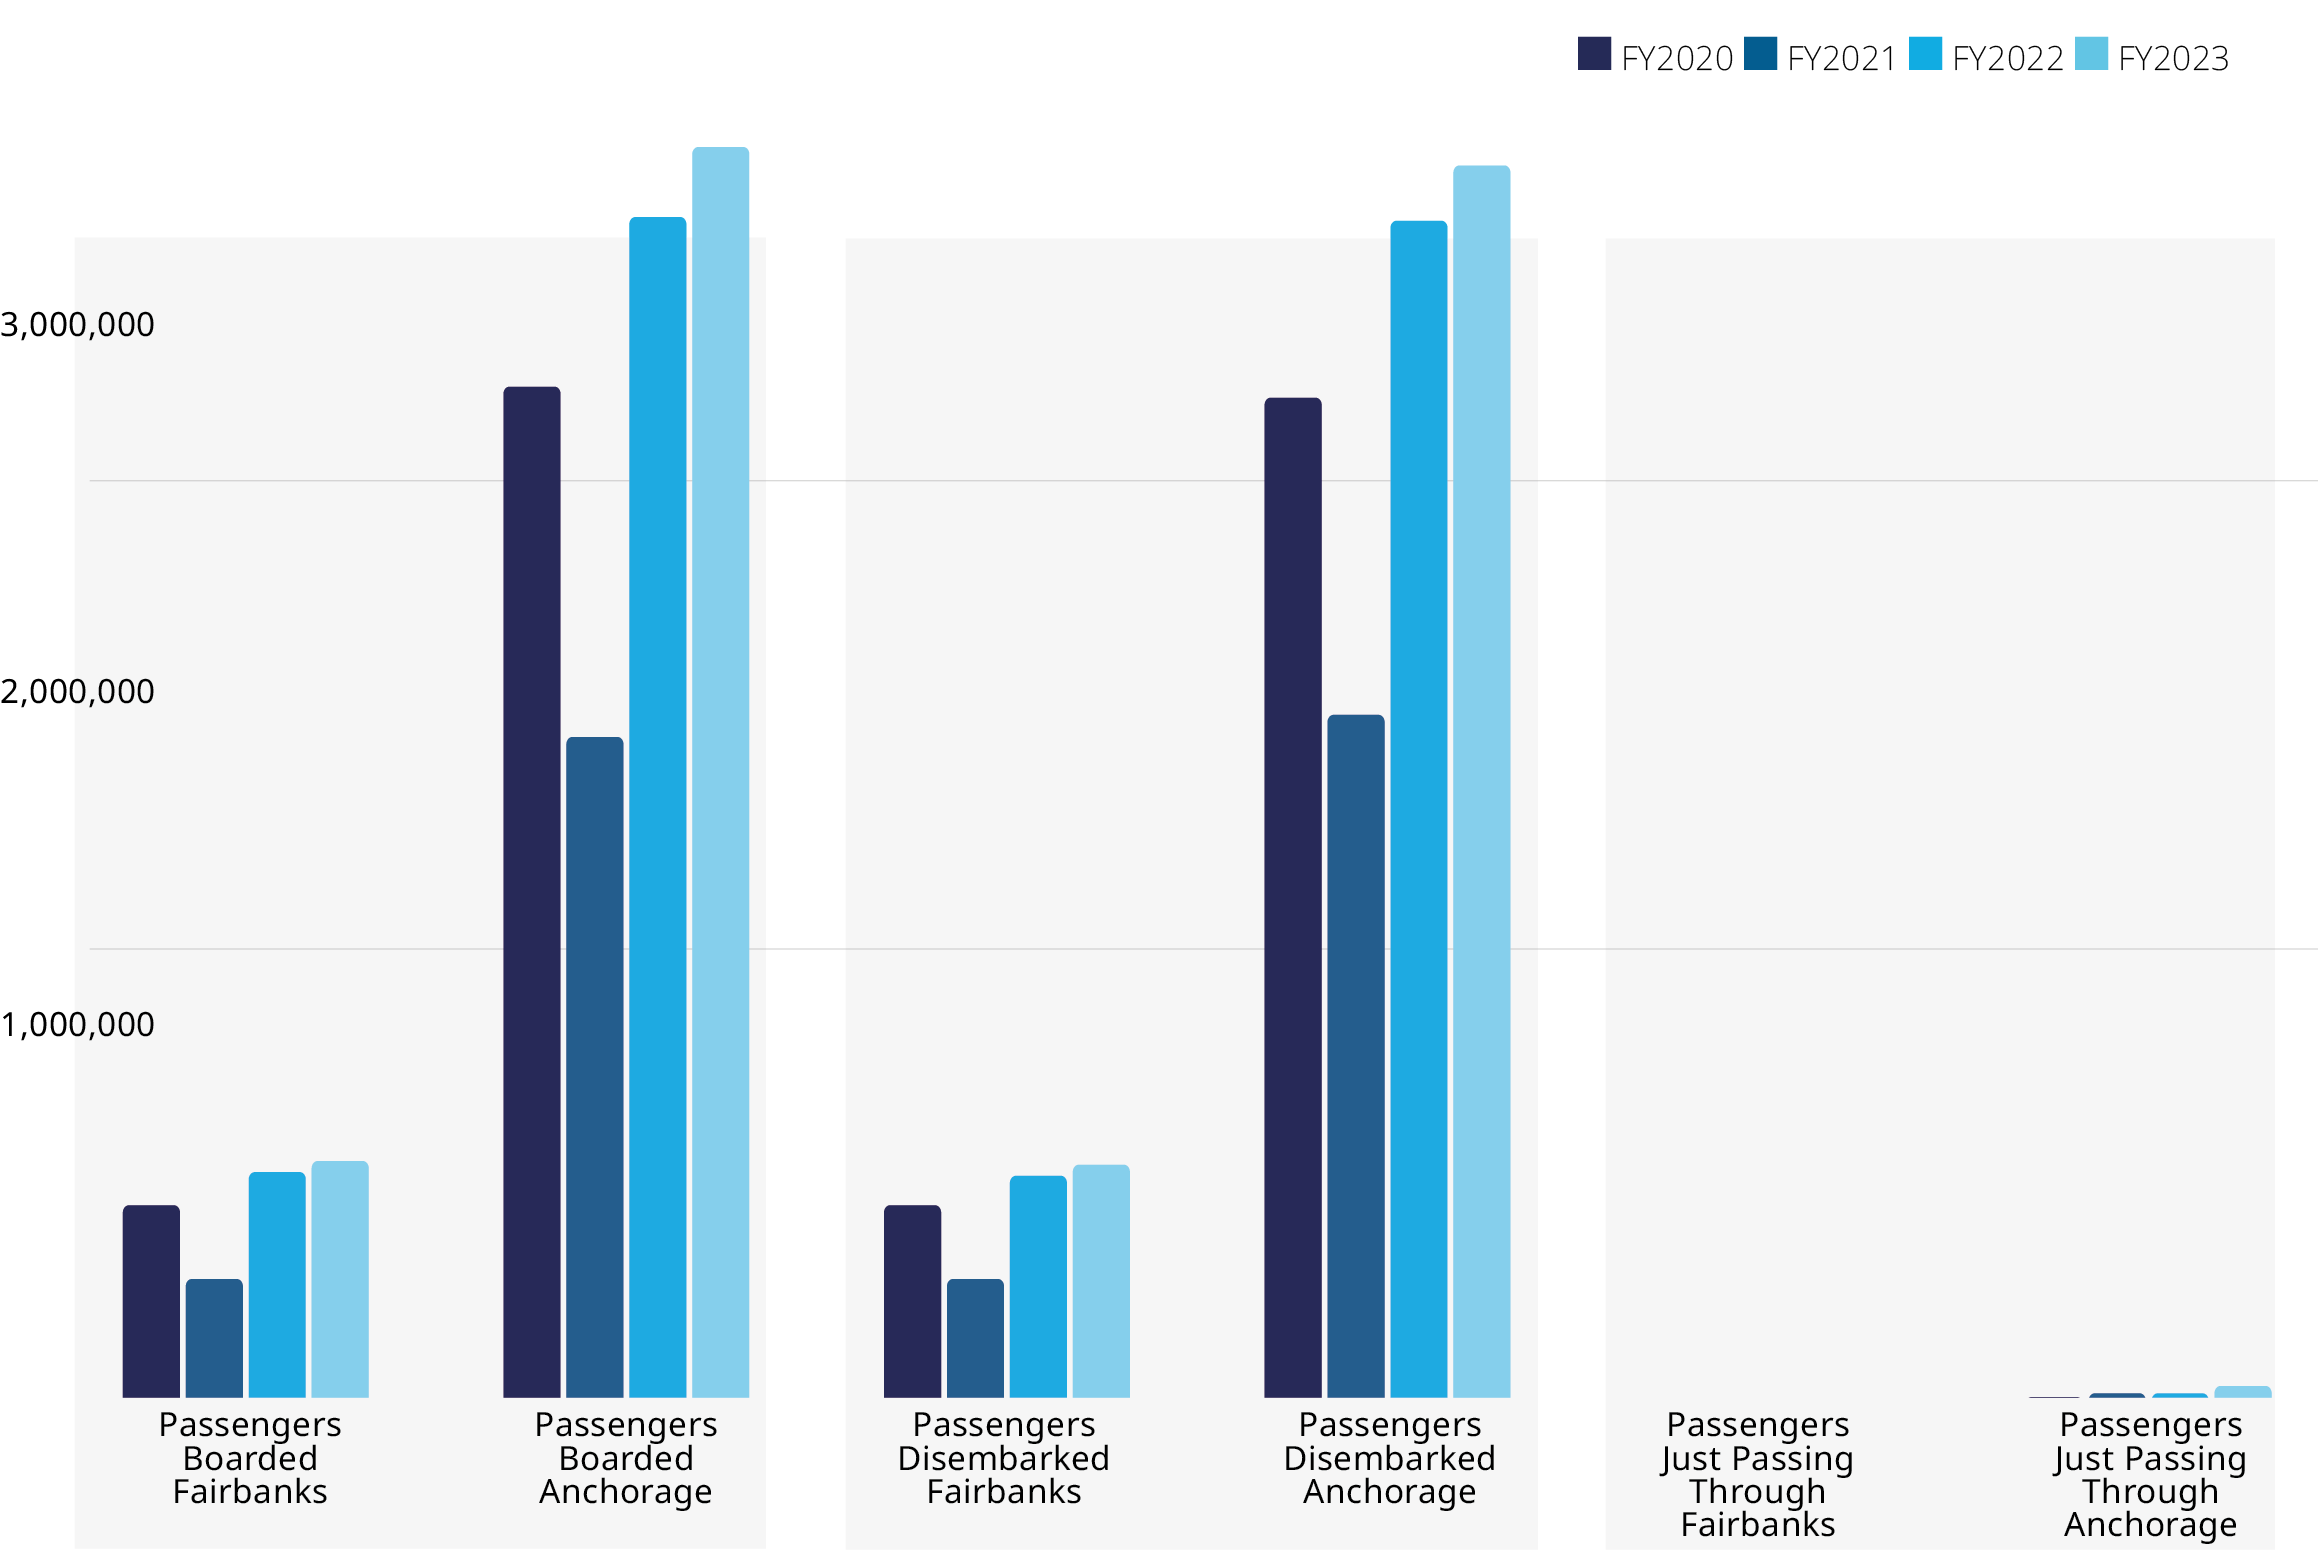
Alaska International Airport System, Annual Activity Summary Report FY20-FY2029; dot.alaska.gov/stwdav/index.shtml


of Alaska communities depend on aviation for year-round access.

Active pilots
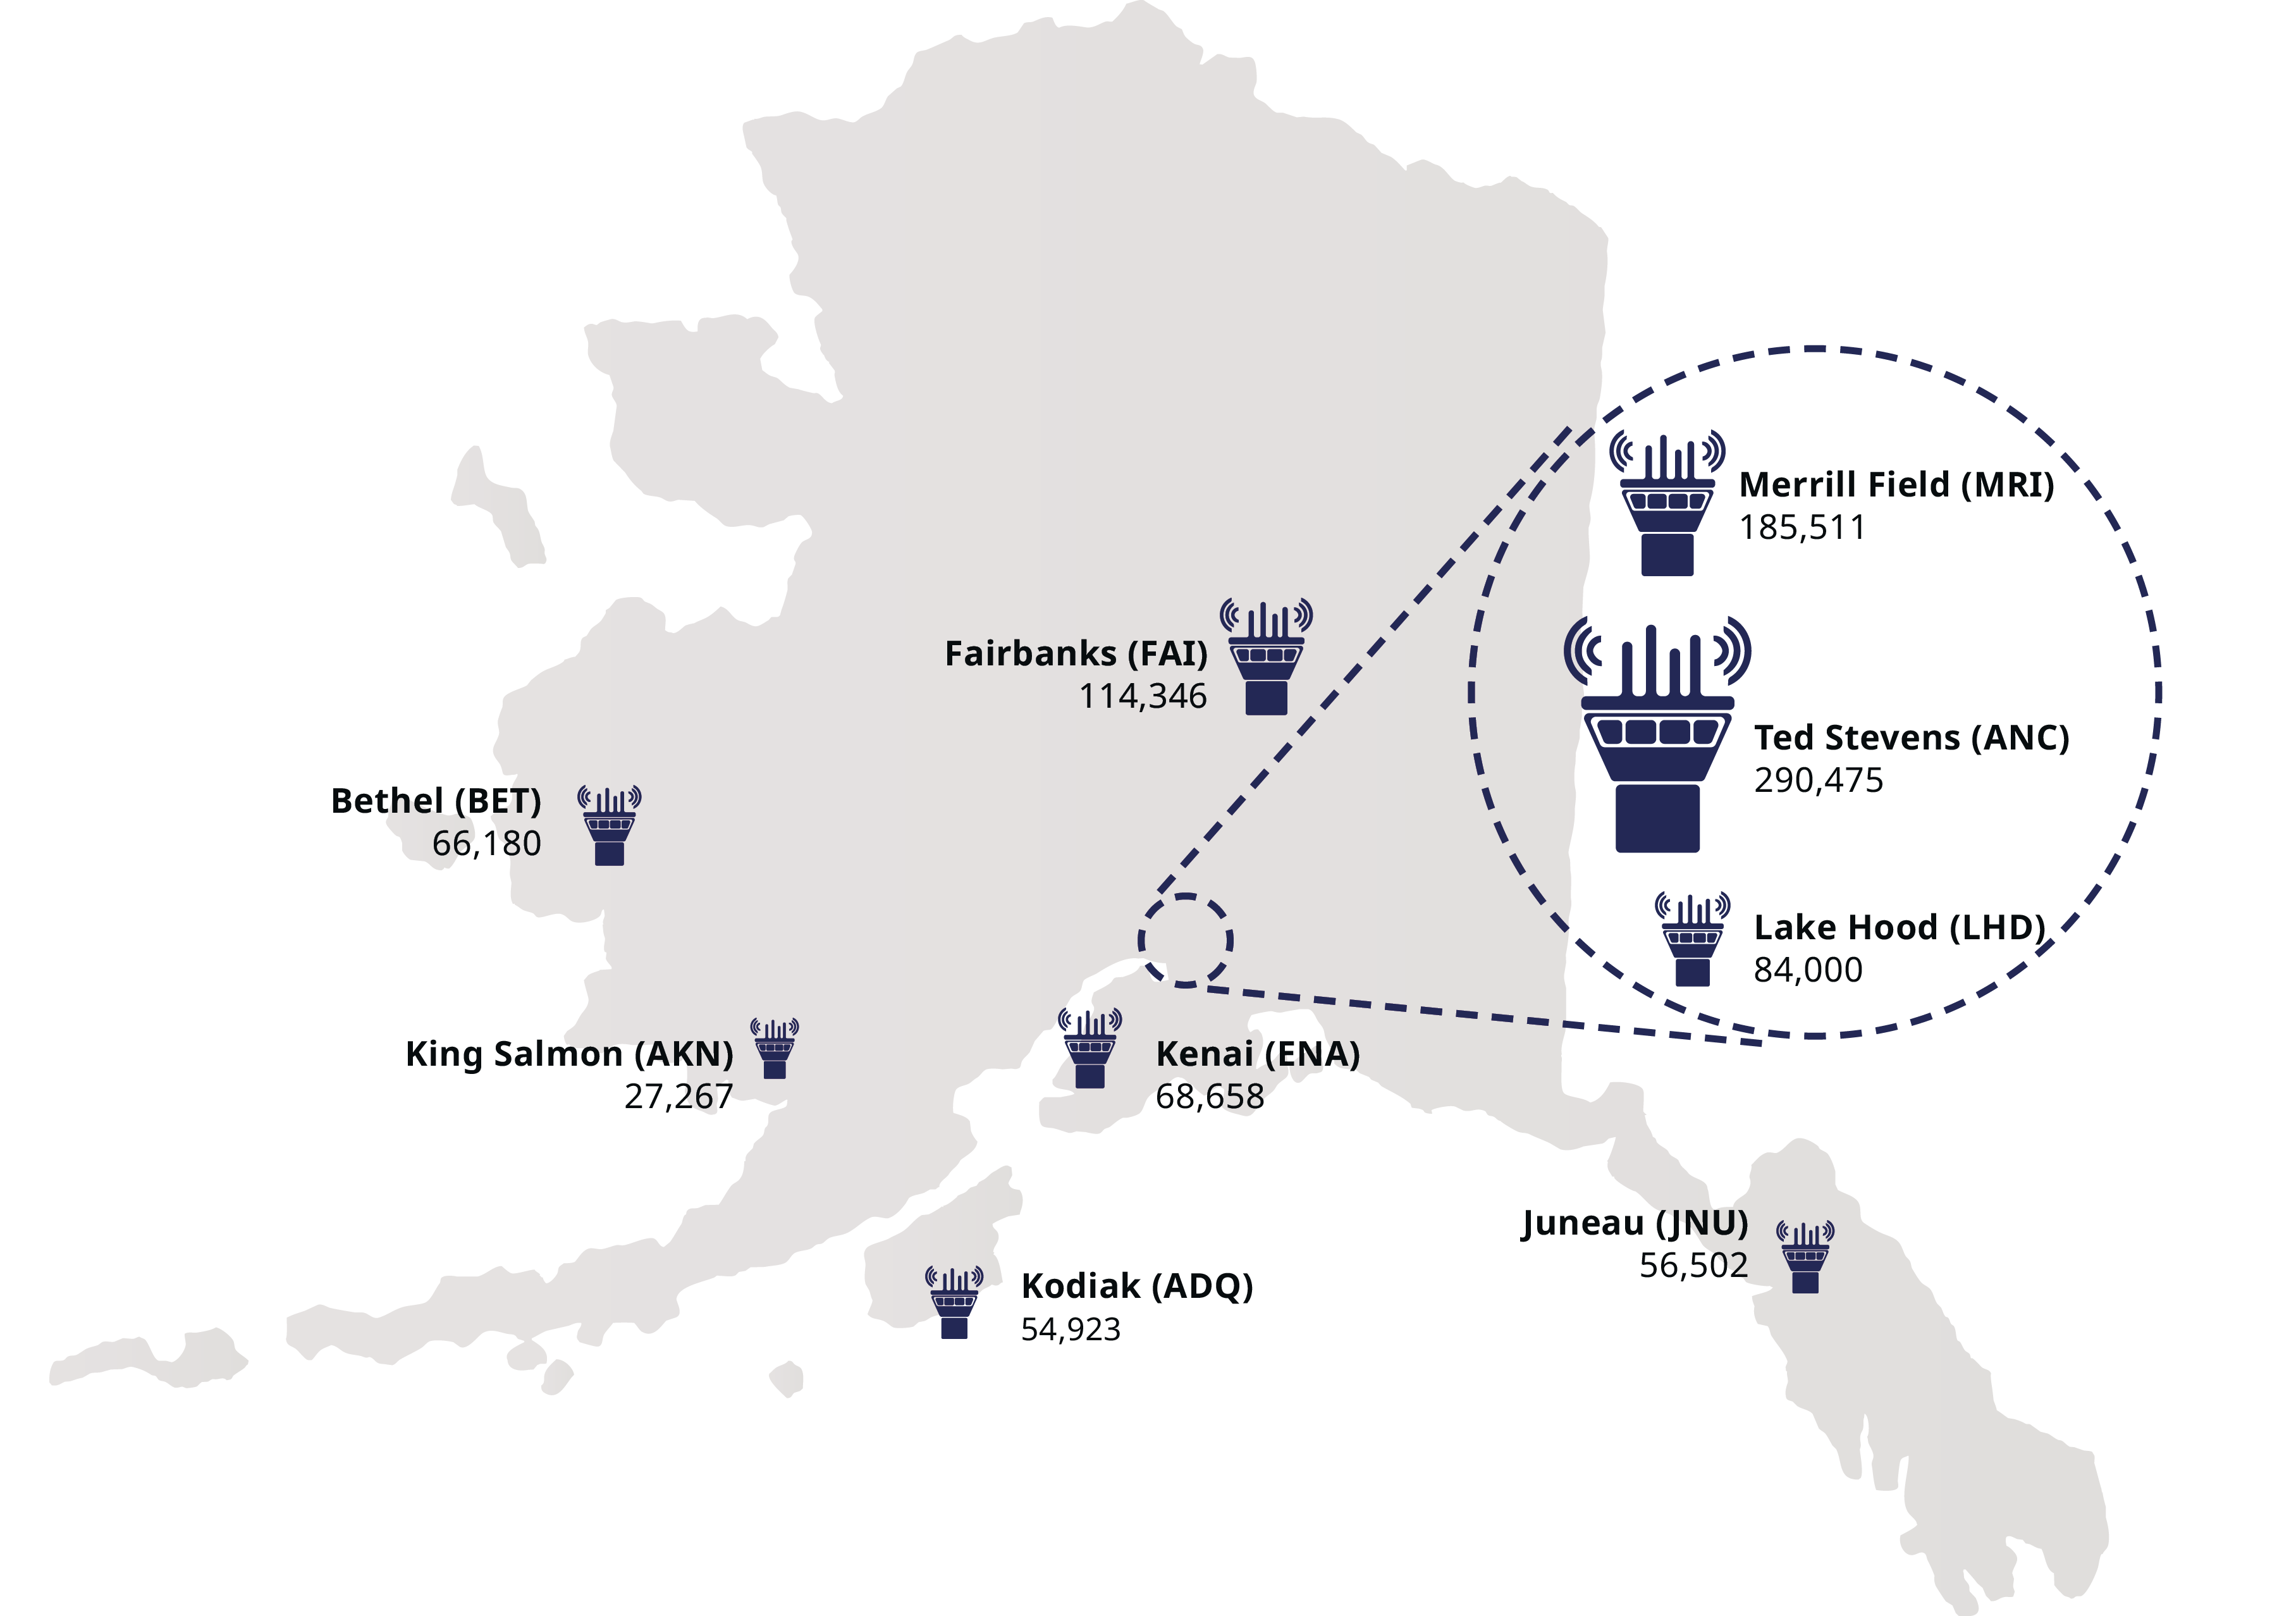
The busiest, by number of tower operations in FY 2021


Aviation-related Jobs

Registered aircraft