Alaska Trends
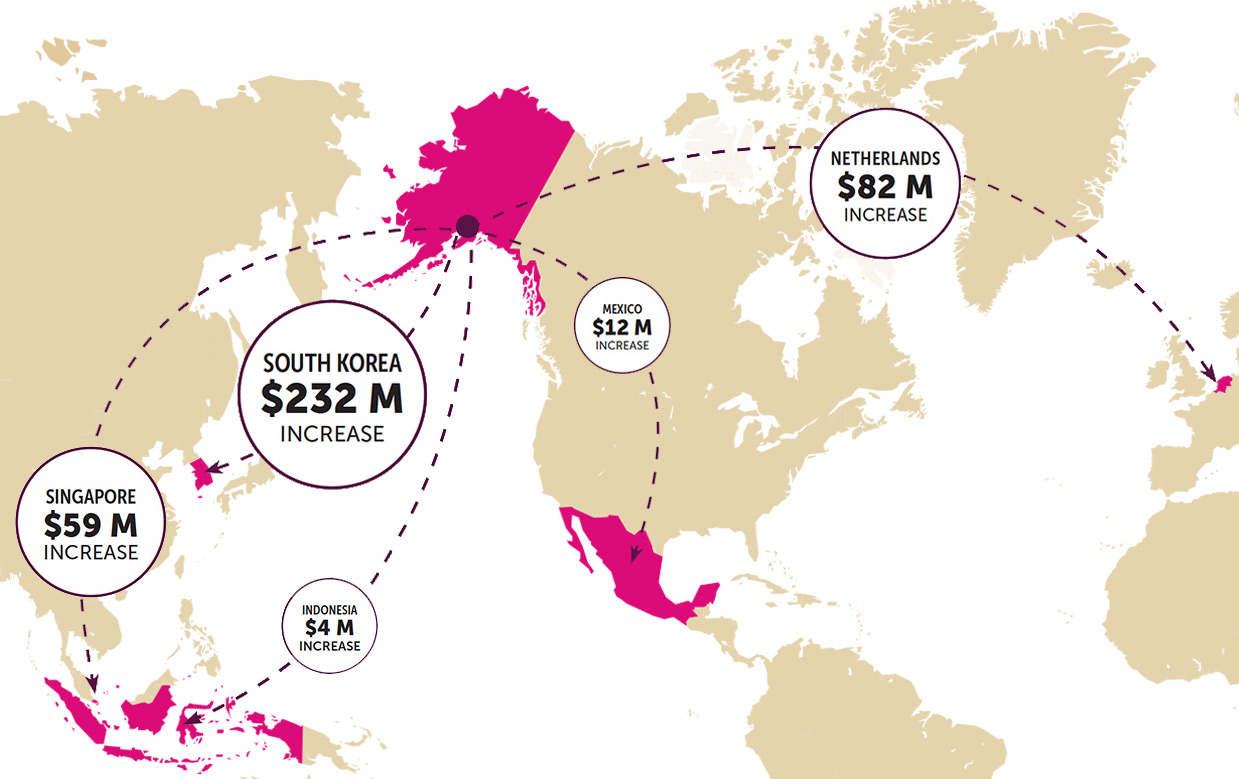
laska is rich in natural resources, so it naturally follows that exports are a vital part of the state’s economy. Alaska has a long history of strong trade relationships with Asia: its three largest export partners (by value) are China, South Korea, and Japan, which account for more than 50 percent of Alaska exports according to 2018 data from the US Census Bureau. And relationships in that region continue to grow—the countries to which Alaska increased exports the most in 2018 include Singapore, Indonesia, and South Korea.
By value, the largest Alaska exports are minerals (zinc tops the list, lead is in the top ten) and seafood (frozen fish meat; frozen fish; frozen Alaska pollock fillets; frozen livers, roe, and milt; frozen sockeye salmon, and frozen cod are in the top ten). The greatest increase in an export (by value) from 2017 to 2018 was “military equipment, not identified,” which jumped 325 percent from $4 million to $16 million. ![]()
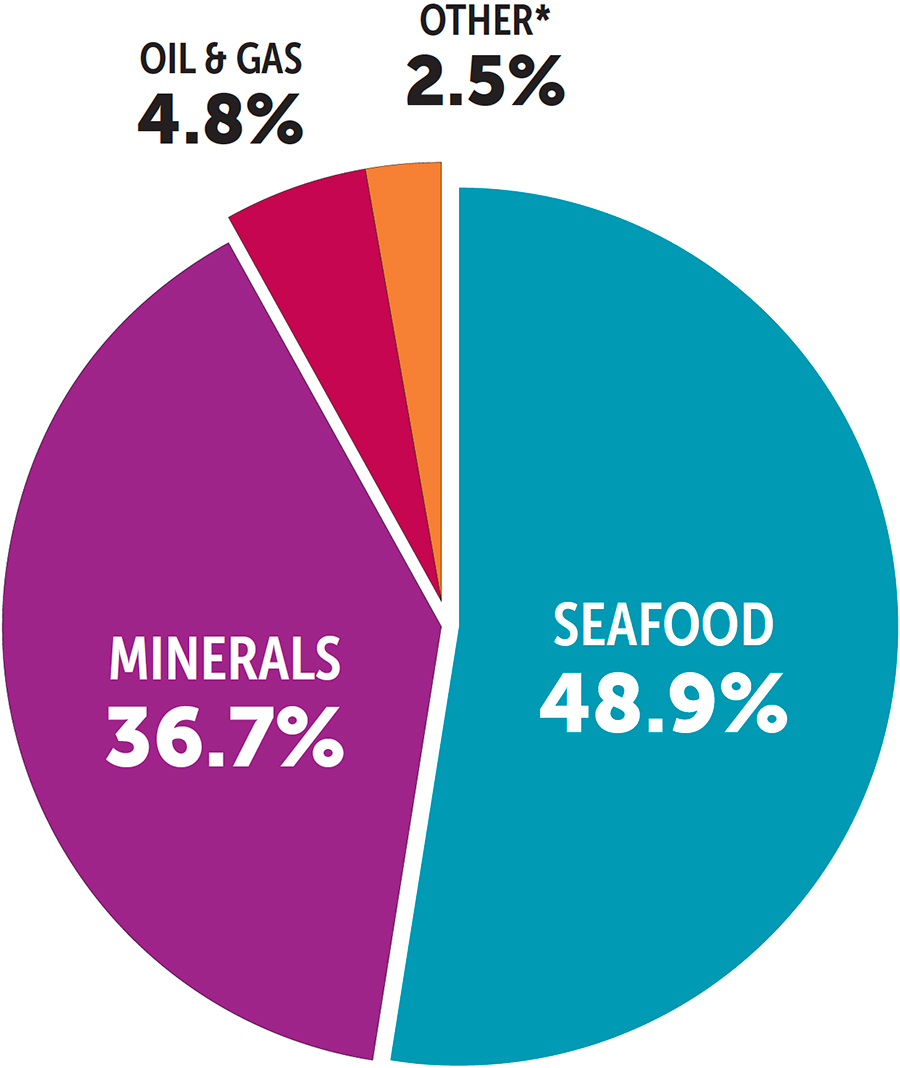
* Other includes: civilian aircraft, engines, and parts; parts of non-powered and powered aircraft, etc.; exports of military equipment, not identifi ed; coniferous wood in the rough, not treated.

EXPORT

EXPORT

EXPORT

EXPORT


ANS Crude Oil Production
ANS West Coast Crude Oil Prices
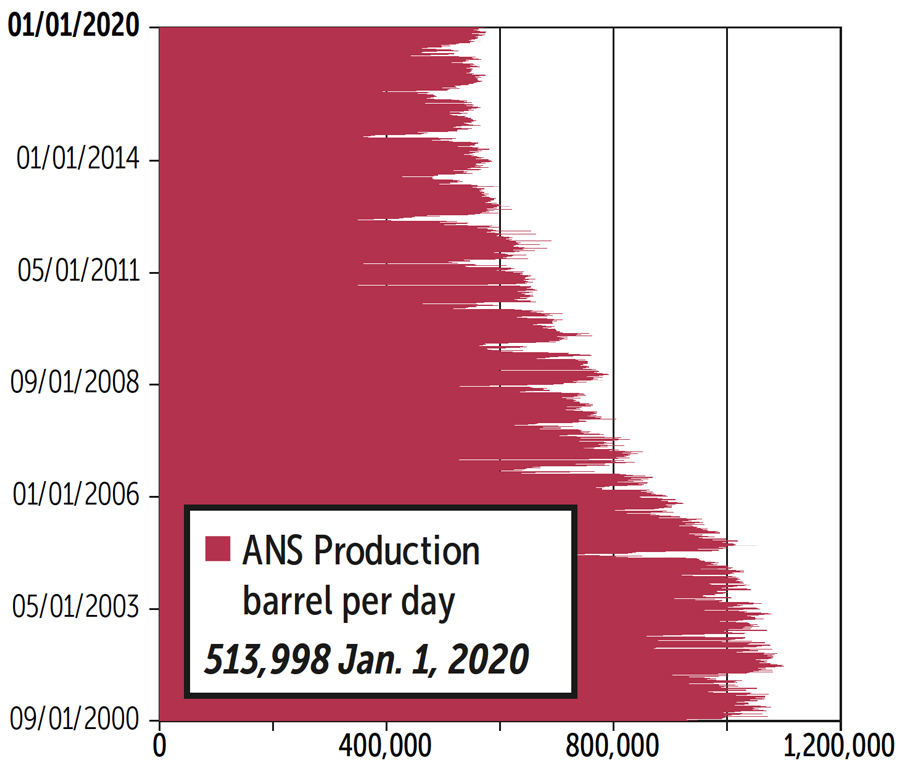
SOURCE: Alaska Department of Revenue Tax Division
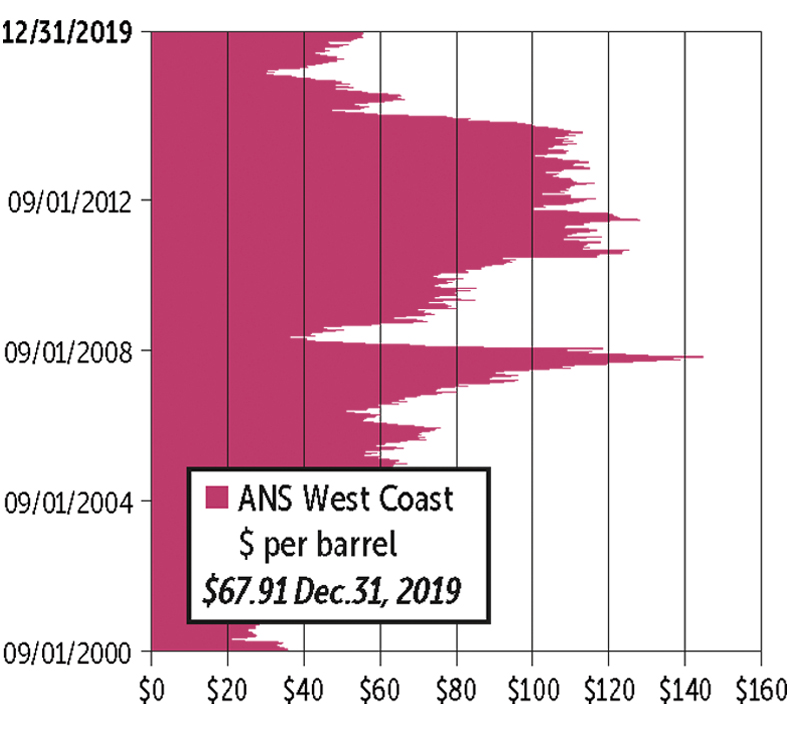
SOURCE: Alaska Department of Revenue Tax Division
Seasonally Adjusted
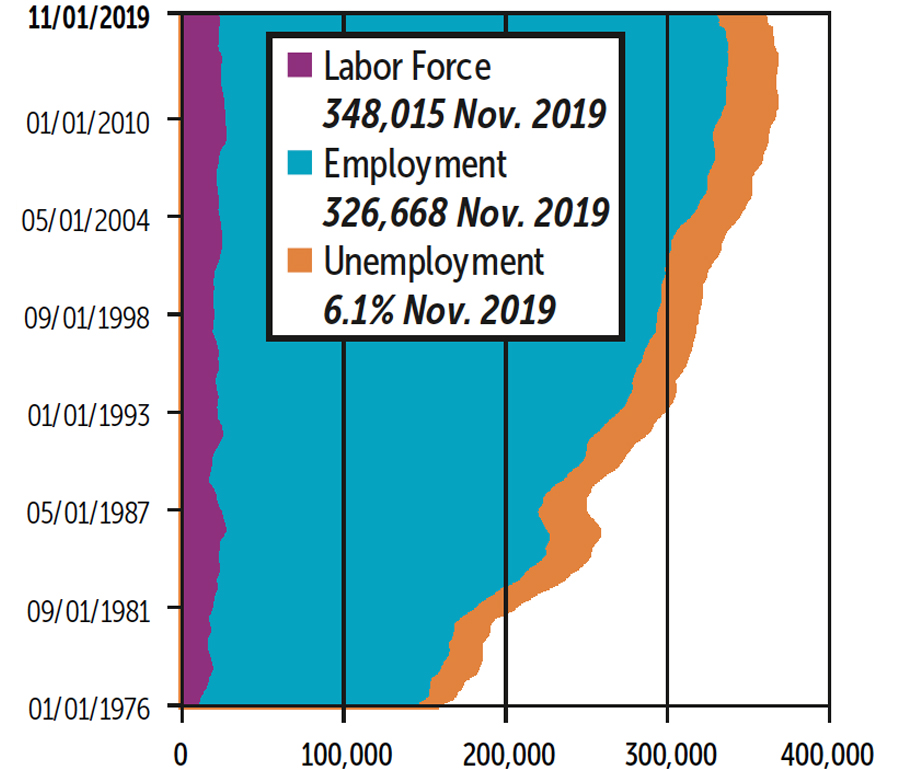
SOURCE: Alaska Department of Labor and Workforce Development, Research & Analysis Section
ANS Crude Oil Production

SOURCE: Alaska Department of Revenue Tax Division
ANS West Coast Crude Oil Prices

SOURCE: Alaska Department of Revenue Tax Division
Statewide Employment Figures
Seasonally Adjusted

SOURCE: Alaska Department of Labor and Workforce Development,
Research & Analysis Section